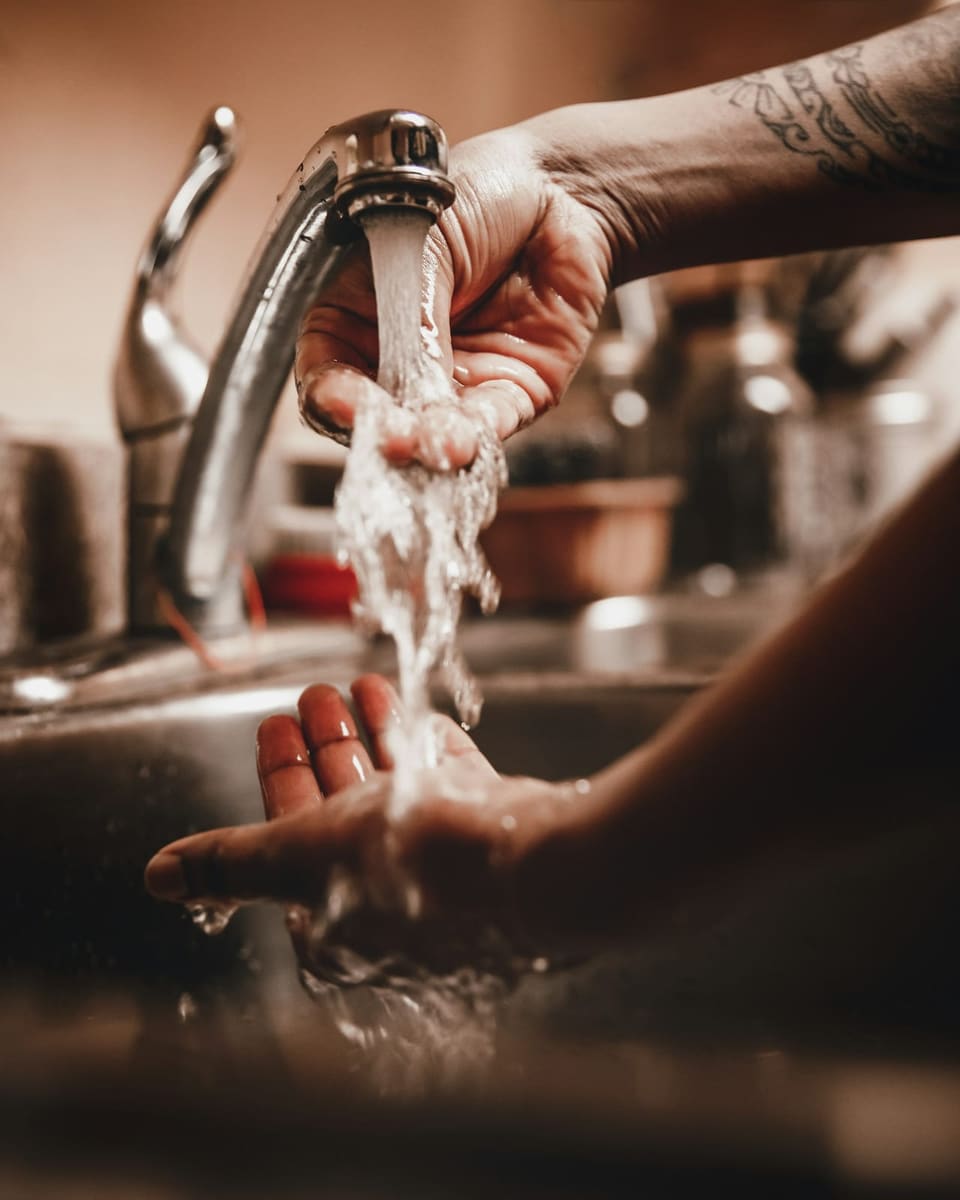
Summary
The effectiveness of physical interventions, such as hand hygiene, masks, and N95/P2 respirators, in reducing the spread of respiratory viruses is uncertain due to a high risk of bias in studies and variations in outcome measurements, but hand hygiene programs may be beneficial in reducing the burden of respiratory illness.
Key points
- Face masks may not have a substantial effect on influenza transmission.
- Eye protection and physical distancing measures are believed to be effective but have limited evidence.
- Hand hygiene may have mixed and inconclusive results in preventing the transmission of respiratory viruses.
- The evidence for non-drug interventions is based on small and underpowered trials with poor reporting of methods and lack of blinding.
Background
Viral epidemics or pandemics of acute respiratory infections (ARIs) pose a global threat. Examples are influenza (H1N1) caused by the H1N1pdm09 virus in 2009, severe acute respiratory syndrome (SARS) in 2003, and coronavirus disease 2019 (COVID‐19) caused by SARS‐CoV‐2 in 2019. Antiviral drugs and vaccines may be insufficient to prevent their spread. This is an update of a Cochrane Review last published in 2020. We include results from studies from the current COVID‐19 pandemic.
Objectives
To assess the effectiveness of physical interventions to interrupt or reduce the spread of acute respiratory viruses.
Search methods
We searched CENTRAL, PubMed, Embase, CINAHL, and two trials registers in October 2022, with backwards and forwards citation analysis on the new studies.
Selection criteria
We included randomised controlled trials (RCTs) and cluster‐RCTs investigating physical interventions (screening at entry ports, isolation, quarantine, physical distancing, personal protection, hand hygiene, face masks, glasses, and gargling) to prevent respiratory virus transmission.
Data collection and analysis
We used standard Cochrane methodological procedures.
Main results
We included 11 new RCTs and cluster‐RCTs (610,872 participants) in this update, bringing the total number of RCTs to 78. Six of the new trials were conducted during the COVID‐19 pandemic; two from Mexico, and one each from Denmark, Bangladesh, England, and Norway. We identified four ongoing studies, of which one is completed, but unreported, evaluating masks concurrent with the COVID‐19 pandemic.
Many studies were conducted during non‐epidemic influenza periods. Several were conducted during the 2009 H1N1 influenza pandemic, and others in epidemic influenza seasons up to 2016. Therefore, many studies were conducted in the context of lower respiratory viral circulation and transmission compared to COVID‐19. The included studies were conducted in heterogeneous settings, ranging from suburban schools to hospital wards in high‐income countries; crowded inner city settings in low‐income countries; and an immigrant neighbourhood in a high‐income country. Adherence with interventions was low in many studies.
The risk of bias for the RCTs and cluster‐RCTs was mostly high or unclear.
Medical/surgical masks compared to no masks
We included 12 trials (10 cluster‐RCTs) comparing medical/surgical masks versus no masks to prevent the spread of viral respiratory illness (two trials with healthcare workers and 10 in the community). Wearing masks in the community probably makes little or no difference to the outcome of influenza‐like illness (ILI)/COVID‐19 like illness compared to not wearing masks (risk ratio (RR) 0.95, 95% confidence interval (CI) 0.84 to 1.09; 9 trials, 276,917 participants; moderate‐certainty evidence. Wearing masks in the community probably makes little or no difference to the outcome of laboratory‐confirmed influenza/SARS‐CoV‐2 compared to not wearing masks (RR 1.01, 95% CI 0.72 to 1.42; 6 trials, 13,919 participants; moderate‐certainty evidence). Harms were rarely measured and poorly reported (very low‐certainty evidence).
N95/P2 respirators compared to medical/surgical masks
We pooled trials comparing N95/P2 respirators with medical/surgical masks (four in healthcare settings and one in a household setting). We are very uncertain on the effects of N95/P2 respirators compared with medical/surgical masks on the outcome of clinical respiratory illness (RR 0.70, 95% CI 0.45 to 1.10; 3 trials, 7779 participants; very low‐certainty evidence). N95/P2 respirators compared with medical/surgical masks may be effective for ILI (RR 0.82, 95% CI 0.66 to 1.03; 5 trials, 8407 participants; low‐certainty evidence). Evidence is limited by imprecision and heterogeneity for these subjective outcomes. The use of a N95/P2 respirators compared to medical/surgical masks probably makes little or no difference for the objective and more precise outcome of laboratory‐confirmed influenza infection (RR 1.10, 95% CI 0.90 to 1.34; 5 trials, 8407 participants; moderate‐certainty evidence). Restricting pooling to healthcare workers made no difference to the overall findings. Harms were poorly measured and reported, but discomfort wearing medical/surgical masks or N95/P2 respirators was mentioned in several studies (very low‐certainty evidence).
One previously reported ongoing RCT has now been published and observed that medical/surgical masks were non‐inferior to N95 respirators in a large study of 1009 healthcare workers in four countries providing direct care to COVID‐19 patients.
Hand hygiene compared to control
Nineteen trials compared hand hygiene interventions with controls with sufficient data to include in meta‐analyses. Settings included schools, childcare centres and homes. Comparing hand hygiene interventions with controls (i.e. no intervention), there was a 14% relative reduction in the number of people with ARIs in the hand hygiene group (RR 0.86, 95% CI 0.81 to 0.90; 9 trials, 52,105 participants; moderate‐certainty evidence), suggesting a probable benefit. In absolute terms this benefit would result in a reduction from 380 events per 1000 people to 327 per 1000 people (95% CI 308 to 342). When considering the more strictly defined outcomes of ILI and laboratory‐confirmed influenza, the estimates of effect for ILI (RR 0.94, 95% CI 0.81 to 1.09; 11 trials, 34,503 participants; low‐certainty evidence), and laboratory‐confirmed influenza (RR 0.91, 95% CI 0.63 to 1.30; 8 trials, 8332 participants; low‐certainty evidence), suggest the intervention made little or no difference. We pooled 19 trials (71, 210 participants) for the composite outcome of ARI or ILI or influenza, with each study only contributing once and the most comprehensive outcome reported. Pooled data showed that hand hygiene may be beneficial with an 11% relative reduction of respiratory illness (RR 0.89, 95% CI 0.83 to 0.94; low‐certainty evidence), but with high heterogeneity. In absolute terms this benefit would result in a reduction from 200 events per 1000 people to 178 per 1000 people (95% CI 166 to 188). Few trials measured and reported harms (very low‐certainty evidence).
We found no RCTs on gowns and gloves, face shields, or screening at entry ports.
Authors' conclusions
The high risk of bias in the trials, variation in outcome measurement, and relatively low adherence with the interventions during the studies hampers drawing firm conclusions. There were additional RCTs during the pandemic related to physical interventions but a relative paucity given the importance of the question of masking and its relative effectiveness and the concomitant measures of mask adherence which would be highly relevant to the measurement of effectiveness, especially in the elderly and in young children.
There is uncertainty about the effects of face masks. The low to moderate certainty of evidence means our confidence in the effect estimate is limited, and that the true effect may be different from the observed estimate of the effect. The pooled results of RCTs did not show a clear reduction in respiratory viral infection with the use of medical/surgical masks. There were no clear differences between the use of medical/surgical masks compared with N95/P2 respirators in healthcare workers when used in routine care to reduce respiratory viral infection. Hand hygiene is likely to modestly reduce the burden of respiratory illness, and although this effect was also present when ILI and laboratory‐confirmed influenza were analysed separately, it was not found to be a significant difference for the latter two outcomes. Harms associated with physical interventions were under‐investigated.
There is a need for large, well‐designed RCTs addressing the effectiveness of many of these interventions in multiple settings and populations, as well as the impact of adherence on effectiveness, especially in those most at risk of ARIs.
PICOs
Population (10)
Adolescent 13-18 years (opens in a new tab) Intervention (11)
Entry point screening (opens in a new tab) Comparison (2)
Outcome (2)
The PICO model is widely used and taught in evidence-based health care as a strategy for formulating questions and search strategies and for characterizing clinical studies or meta-analyses. PICO stands for four different potential components of a clinical question: Patient, Population or Problem; Intervention; Comparison; Outcome.
See more on using PICO in the Cochrane Handbook (opens in a new tab).
Plain language summary
Do physical measures such as hand‐washing or wearing masks stop or slow down the spread of respiratory viruses?
Key messages
We are uncertain whether wearing masks or N95/P2 respirators helps to slow the spread of respiratory viruses based on the studies we assessed.
Hand hygiene programmes may help to slow the spread of respiratory viruses.
How do respiratory viruses spread?
Respiratory viruses are viruses that infect the cells in your airways: nose, throat, and lungs. These infections can cause serious problems and affect normal breathing. They can cause flu (influenza), severe acute respiratory syndrome (SARS), and COVID‐19.
People infected with a respiratory virus spread virus particles into the air when they cough or sneeze. Other people become infected if they come into contact with these virus particles in the air or on surfaces on which they land. Respiratory viruses can spread quickly through a community, through populations and countries (causing epidemics), and around the world (causing pandemics).
Physical measures to try to prevent respiratory viruses spreading between people include:
· washing hands often;
· not touching your eyes, nose, or mouth;
· sneezing or coughing into your elbow;
· wiping surfaces with disinfectant;
· wearing masks, eye protection, gloves, and protective gowns;
· avoiding contact with other people (isolation or quarantine);
· keeping a certain distance away from other people (distancing); and
· examining people entering a country for signs of infection (screening).
What did we want to find out?
We wanted to find out whether physical measures stop or slow the spread of respiratory viruses from well‐controlled studies in which one intervention is compared to another, known as randomised controlled trials.
What did we do?
We searched for randomised controlled studies that looked at physical measures to stop people acquiring a respiratory virus infection.
We were interested in how many people in the studies caught a respiratory virus infection, and whether the physical measures had any unwanted effects.
What did we find?
We identified 78 relevant studies. They took place in low‐, middle‐, and high‐income countries worldwide: in hospitals, schools, homes, offices, childcare centres, and communities during non‐epidemic influenza periods, the global H1N1 influenza pandemic in 2009, epidemic influenza seasons up to 2016, and during the COVID‐19 pandemic. We identified five ongoing, unpublished studies; two of them evaluate masks in COVID‐19. Five trials were funded by government and pharmaceutical companies, and nine trials were funded by pharmaceutical companies.
No studies looked at face shields, gowns and gloves, or screening people when they entered a country.
We assessed the effects of:
· medical or surgical masks;
· N95/P2 respirators (close‐fitting masks that filter the air breathed in, more commonly used by healthcare workers than the general public); and
· hand hygiene (hand‐washing and using hand sanitiser).
We obtained the following results:
Medical or surgical masks
Ten studies took place in the community, and two studies in healthcare workers. Compared with wearing no mask in the community studies only, wearing a mask may make little to no difference in how many people caught a flu‐like illness/COVID‐like illness (9 studies; 276,917 people); and probably makes little or no difference in how many people have flu/COVID confirmed by a laboratory test (6 studies; 13,919 people). Unwanted effects were rarely reported; discomfort was mentioned.
N95/P2 respirators
Four studies were in healthcare workers, and one small study was in the community. Compared with wearing medical or surgical masks, wearing N95/P2 respirators probably makes little to no difference in how many people have confirmed flu (5 studies; 8407 people); and may make little to no difference in how many people catch a flu‐like illness (5 studies; 8407 people), or respiratory illness (3 studies; 7799 people). Unwanted effects were not well‐reported; discomfort was mentioned.
Hand hygiene
Following a hand hygiene programme may reduce the number of people who catch a respiratory or flu‐like illness, or have confirmed flu, compared with people not following such a programme (19 studies; 71,210 people), although this effect was not confirmed as statistically significant reduction when ILI and laboratory‐confirmed ILI were analysed separately. Few studies measured unwanted effects; skin irritation in people using hand sanitiser was mentioned.
What are the limitations of the evidence?
Our confidence in these results is generally low to moderate for the subjective outcomes related to respiratory illness, but moderate for the more precisely defined laboratory‐confirmed respiratory virus infection, related to masks and N95/P2 respirators. The results might change when further evidence becomes available. Relatively low numbers of people followed the guidance about wearing masks or about hand hygiene, which may have affected the results of the studies.
How up to date is this evidence?
We included evidence published up to October 2022.
Authors' conclusions
Implications for practice
The evidence summarised in this review on the use of masks is largely based on studies conducted during traditional peak respiratory virus infection seasons up until 2016. Two relevant randomised trials conducted during the COVID‐19 pandemic have been published, but their addition had minimal impact on the overall pooled estimate of effect. The observed lack of effect of mask wearing in interrupting the spread of influenza‐like illness (ILI) or influenza/COVID‐19 in our review has many potential reasons, including: poor study design; insufficiently powered studies arising from low viral circulation in some studies; lower adherence with mask wearing, especially amongst children; quality of the masks used; self‐contamination of the mask by hands; lack of protection from eye exposure from respiratory droplets (allowing a route of entry of respiratory viruses into the nose via the lacrimal duct); saturation of masks with saliva from extended use (promoting virus survival in proteinaceous material); and possible risk compensation behaviour leading to an exaggerated sense of security (Ammann 2022 (opens in a new tab); Brosseau 2020 (opens in a new tab); Byambasuren 2021 (opens in a new tab); Canini 2010 (opens in a new tab); Cassell 2006 (opens in a new tab); Coroiu 2021 (opens in a new tab); MacIntyre 2015 (opens in a new tab); Rengasamy 2010 (opens in a new tab); Zamora 2006 (opens in a new tab)).
Our findings show that hand hygiene has a modest effect as a physical intervention to interrupt the spread of respiratory viruses, but several questions remain. First, the high heterogeneity between studies may suggest that there are differences in the effect of different interventions. The poor reporting limited our ability to extract the information needed to assess any 'dose response' relationship, and there are few head‐to‐head trials comparing hand hygiene materials (such as alcohol‐based sanitiser or soap and water). Second, the sustainability of hand hygiene is unclear where participants in some studies achieved 5 to 10 hand‐washings per day, but adherence may have diminished with time as motivation decreased, or due to adverse effects from frequent hand‐washing. Third, there is little evidence about the effectiveness of combinations of hand hygiene with other interventions, and how those are best introduced and sustained. Finally, some interventions were intensively implemented within small organisations, and involved education or training as a component, and the ability to scale these up to broader interventions is unclear.
Our findings with respect to hand hygiene should be considered generally relevant to all viral respiratory infections, given the diverse populations where transmission of viral respiratory infections occurs. The participants were adults, children and families, and multiple congregation settings including schools, childcare centres, homes, and offices. Most respiratory viruses, including the pandemic SARS‐CoV‐2, are considered to be predominantly spread via respiratory particles of varying size or contact routes, or both (WHO 2020c (opens in a new tab)). Data from studies of SARS‐CoV‐2 contamination of the environment based on the presence of viral ribonucleic acid and infectious virus suggest significant fomite contamination (Lin 2022 (opens in a new tab); Onakpoya 2022b (opens in a new tab); Ong 2020 (opens in a new tab); Wu 2020 (opens in a new tab)). Hand hygiene would be expected to be beneficial in reducing the spread of SARS‐CoV‐2 similar to other beta coronaviruses (SARS‐CoV‐1, Middle East respiratory syndrome (MERS), and human coronaviruses), which are very susceptible to the concentrations of alcohol commonly found in most hand‐sanitiser preparations (Rabenau 2005 (opens in a new tab); WHO 2020c (opens in a new tab)). Support for this effect is the finding that poor hand hygiene, despite the use of full personal protective equipment (PPE), was independently associated with an increased risk of SARS‐CoV‐2 transmission to healthcare workers in a retrospective cohort study in Wuhan, China in both a high‐risk and low‐risk clinical unit for patients infected with COVID‐19 (Ran 2020 (opens in a new tab)). The practice of hand hygiene appears to have a consistent effect in all settings, and should be an essential component of other interventions.
The highest‐quality cluster‐RCTs indicate that the most effect on preventing respiratory virus spread from hygienic measures occurs in younger children. This may be because younger children are least capable of hygienic behaviour themselves (Roberts 2000 (opens in a new tab)), and have longer‐lived infections and greater social contact, thereby acting as portals of infection into the household (Monto 1969 (opens in a new tab)). Additional benefit from reduced transmission from them to other members of the household is broadly supported by the results of other study designs where the potential for confounding is greater.
Routine long‐term implementation of some of the interventions covered in this review may be problematic, particularly maintaining strict hygiene and barrier routines for long periods of time. This would probably only be feasible in highly motivated environments, such as hospitals. Many of the trial authors commented on the major logistical burdens that barrier routines imposed at the community level. However, the threat of a looming epidemic may provide stimulus for their inception.
Implications for research
Public health measures and physical interventions can be highly effective to interrupt the spread of respiratory viral infections, especially when they are part of a structured and co‐ordinated programme that includes instruction and education, and when they are delivered together and with high adherence. Our review has provided important insights into research gaps that need to be addressed with respect to these physical interventions and their implementation and have been brought into a sharper focus as a result of the COVID‐19 pandemic. The 2014 WHO document 'Infection prevention and control of epidemic ‐ and pandemic‐prone acute respiratory infections in health care' identified several research gaps as part of their GRADE assessment of their infection prevention and control recommendations, which remain very relevant (WHO 2014 (opens in a new tab)). Research gaps identified during the course of our review and the WHO 2014 (opens in a new tab) document may be considered from the perspective of both general and specific themes.
A general theme identified was the need to provide outcomes with explicitly defined clinical criteria for acute respiratory infections (ARIs) and discrete laboratory‐confirmed outcomes of viral ARIs using molecular diagnostic tools which are now widely available. Our review found large disparities between studies with respect to the clinical outcome events, which were imprecisely defined in several studies, and there were differences in the extent to which laboratory‐confirmed viruses were included in the studies that assessed them. Another general theme identified was the lack of consideration of sociocultural factors that might affect adherence with the interventions, especially those employed in the community setting. A prime example of this latter point was illustrated by the observations of the use of masks versus mask mandates during the COVID‐19 pandemic. In addition, the cost and resource implications of the physical interventions employed in different settings would have important relevance for low‐ to middle‐income countries. Resources have been a major issue with the COVID‐19 pandemic, with global shortages of several components of PPE. Several specific research gaps related to physical interventions were identified within the WHO 2014 (opens in a new tab) document and are congruent with many of the findings of this 2022 update, including the following: transmission dynamics of respiratory viruses from patients to healthcare workers during aerosol‐generating procedures; a continued lack of precision with regards to defining aerosol‐generating procedures; the safety of cohorting of patients with the same suspected but unconfirmed diagnosis in a common unit or ward with patients infected with the same known pathogen in healthcare settings; the optimal duration of the use of physical interruptions to prevent spread of ARI viruses; use of spatial separation or physical distancing (in healthcare and community settings, respectively) alone versus spatial separation or physical distancing with the use of other added physical interventions coupled with examining discrete distance parameters (e.g. one metre, two metres, or > two metres); the effectiveness of respiratory etiquette (i.e. coughing/sneezing into tissues or a sleeved bent elbow); the effectiveness of triage and early identification of infected individuals with an ARI in both hospital and community settings; the utility of entrance screening to healthcare facilities; use of frequent disinfection techniques appropriate to the setting (high‐touch surfaces in the environment, gargling with oral disinfectants, and virucidal tissues or clothing) alone or in combination with facial masks and hand hygiene; the use of visors, goggles or other eyewear; the use of ultraviolet light germicidal irradiation for disinfection of air in healthcare and selected community settings; the use of air scrubbers and /or high‐efficiency particulate absorbing filters and the use of widespread adherence with effective vaccination strategies.
There is a clear requirement to conduct large, pragmatic trials to evaluate the best combinations in the community and in healthcare settings with multiple respiratory viruses and in different sociocultural settings. Randomised controlled trials (RCTs) with a pragmatic design, similar to the Luby 2005 (opens in a new tab) trial or the Bundgaard 2020 (opens in a new tab) trial, should be conducted whenever possible. Similar to what has been observed in pharmaceutical interventions where multiple RCTs were rapidly and successfully completed during the COVID‐19 pandemic, proving they can be accomplished, there should be a deliberate emphasis and directed funding opportunities provided to conduct well‐designed RCTs to address the effectiveness of many of the physical interventions in multiple settings and populations, especially in those most at risk, and in very specific well‐defined populations with monitoring of the adherence to the interventions.
Several specific research gaps deserve expedited attention and may be highlighted within the context of the COVID‐19 pandemic. The use of face masks in the community setting represents one of the most pressing needs to address, given the polarised opinions around the world, and the increasing concerns over widespread microplastic pollution from the discarding of masks (Shen 2021 (opens in a new tab)). Both broad‐based ecological studies, adjusting for confounding and high quality RCTs, may be necessary to determine if there is an independent contribution to their use as a physical intervention, and how they may best be deployed to optimise their contribution. The type of fabric and weave used in the face mask is an equally pressing concern, given that surgical masks with their cotton‐polypropylene fabric appear to be effective in the healthcare setting, but there are questions about the effectiveness of simple cotton masks. In addition, any masking intervention studies should focus on measuring not only benefits but also adherence, harms, and risk compensation if the latter may lead to a lower protective effect. In addition, although the use of medical/surgical masks versus N95 respirators demonstrates no differences in clinical effectiveness to date, their use needs to be further studied within the context of a well‐designed RCT in the setting of COVID‐19, and with concomitant measurement of harms, which to date have been poorly studied. The recently published Loeb RCT conducted over a prolonged course in the current pandemic has provided the only evidence to date in this area (Loeb 2022 (opens in a new tab)).
Physical distancing represents another major research gap which needs to be addressed expediently, especially within the context of the COVID‐19 pandemic setting as well as in future epidemic settings. The use of quarantine and screening at entry ports needs to be investigated in well‐designed, high‐quality RCTs given the controversies related to airports and travel restrictions which emerged during the COVID‐19 pandemic. We found only one RCT investigating quarantine, and no trials of screening at entry ports or physical distancing. Given that these and other physical interventions are some of the primary strategies applied globally in the face of the COVID‐19 pandemic, future trials of high quality should be a major global priority to be conducted within the context of this pandemic, as well as in future epidemics with other respiratory viruses of less virulence.
The variable quality and small scale of some studies is known from descriptive studies (Aiello 2002 (opens in a new tab); Fung 2006 (opens in a new tab); WHO 2006b (opens in a new tab)), and systematic reviews of selected interventions (Meadows 2004 (opens in a new tab)). In summary, more high‐quality RCTs are needed to evaluate the most effective strategies to implement successful physical interventions in practice, both on a small scale and at a population level. It is very unfortunate that more rigorous planning, effort and funding was not provided during the current COVID‐19 pandemic towards high‐quality RCTs of the basic public health measures. Finally, we emphasise that more attention should be paid to describing and quantifying the harms of the interventions assessed in this review, and their relationship with adherence.
Summary of findings
Open in table viewer (opens in a new tab)
Summary of findings 1. Medical/surgical masks compared to no masks for preventing the spread of viral respiratory illness
Open in table viewer (opens in a new tab)
Summary of findings 2. N95 respirators compared to medical/surgical masks for preventing the spread of viral respiratory illness
Open in table viewer (opens in a new tab)
Summary of findings 3. Hand hygiene compared to control for preventing the spread of viral respiratory illness
Background
Description of the condition
Epidemic and pandemic viral infections pose a serious threat to people worldwide. Epidemics of note include severe acute respiratory syndrome (SARS) in 2003 and the Middle East respiratory syndrome (MERS), which began in 2012, and the current SARS‐CoV‐2 pandemic. Major pandemics include the H1N1 influenza caused by the H1N1pdm09 virus in 2009 and the coronavirus disease 2019 (COVID‐19) caused by SARS‐CoV‐2.
Even non‐epidemic acute respiratory infections (ARIs) place a huge burden on healthcare systems around the world, and are a prominent cause of morbidity (WHO 2017 (opens in a new tab)). Furthermore, ARIs are often antecedents to lower respiratory tract infections (RTIs) caused by bacterial pathogens (i.e. pneumonia), which cause millions of deaths worldwide, mostly in low‐income countries (Schwartz 2018 (opens in a new tab)).
High viral load, high levels of transmissibility, susceptible populations, and symptomatic patients are considered to be the drivers of such epidemics and pandemics (Jefferson 2006a (opens in a new tab)). Preventing the spread of respiratory viruses from person to person may be effective at reducing the spread of outbreaks.
Physical interventions, such as the use of masks and physical distancing measures, might prevent the spread of respiratory viruses which are considered to be transmitted by multiple modes of transmission including by respiratory particles of varying sizes spreading from infected to susceptible people and through direct and indirect contact (Kutter 2018 (opens in a new tab); Leung 2021 (opens in a new tab)). It is recognised that there is a continuum of respiratory particle sizes varying between large droplet to fine aerosols, which is an important concept. Particles of a variety of sizes may be expelled from the human airway during coughing, sneezing, singing, talking, and during certain medical procedures (WHO 2021 (opens in a new tab)). In addition, transmission of respiratory viruses is likely highly complex, dependent on multiple host, virus and environmental factors, plus the myriad of interactions between these factors, which may influence the predominant modes of transmission in any given setting (Broderick 2008 (opens in a new tab); Hendley 1988 (opens in a new tab); Kutter 2018 (opens in a new tab); Leung 2021 (opens in a new tab)). Current evidence suggests that the virus responsible for the current COVID‐19 pandemic spreads mainly between people who are in close contact with each other (Onakpoya 2022a (opens in a new tab)).
It is also unknown if all respiratory viruses or different strains of a specific respiratory virus transmit in a similar manner, further adding to the complexity of respiratory virus transmission.
Description of the intervention
Single measures of intervention such as the use of vaccines or antivirals, may be insufficient to contain the spread of influenza, but combinations of interventions may reduce the reproduction number to below 1 (Demicheli 2018a (opens in a new tab); Demicheli 2018b (opens in a new tab); Jefferson 2014 (opens in a new tab); Jefferson 2018 (opens in a new tab); Thomas 2010 (opens in a new tab)). When the reproduction number (or R0) is below 1, each infection causes less than one new secondary infection and the disease will eventually die out. For some respiratory viruses there are no licensed interventions, and a combination of social and physical interventions may be the only option to reduce the spread of outbreaks, particularly those that may be capable of becoming epidemic or pandemic in nature (Luby 2005 (opens in a new tab)). Such interventions were emphasised in the World Health Organization's latest Global Influenza Strategy 2019 to 2030, and have several possible advantages over other methods of suppressing ARI outbreaks since they may be instituted rapidly and may be independent of any specific type of infective agent, including novel viruses. In addition, the possible effectiveness of public health measures during the Spanish flu pandemic of 1918 to 1919 in US cities supports the impetus to investigate the existing evidence on the effectiveness of such interventions (Bootsma 2007 (opens in a new tab)), including quarantine (such as isolation, physical distancing) and the use of disinfectants. We also considered the major societal implications for any community adopting these measures (CDC 2005a (opens in a new tab); CDC 2005b (opens in a new tab); WHO 2006b (opens in a new tab); WHO 2020a (opens in a new tab); WHO 2020b (opens in a new tab)).
How the intervention might work
Epidemics and pandemics are more likely during antigenic change (changes in the viral composition) in the virus or transmission from animals (domestic or wild) when there is no natural human immunity (Bonn 1997 (opens in a new tab)). High viral load, high levels of transmissibility, and symptomatic patients are considered to be the drivers of such epidemics and pandemics (Jefferson 2006b (opens in a new tab)).
Physical interventions, such as the use of masks (Greenhalgh 2020 (opens in a new tab); Howard 2020 (opens in a new tab)), physical distancing measures, school closures, and limitations of mass gatherings, might prevent the spread of the virus transmitted by infectious respiratory particles from infected to susceptible individuals. The use of hand hygiene, gloves, and protective gowns can also prevent the spread by limiting the transfer of viral particles onto and from fomites (inanimate objects such as flat surfaces, tabletops, utensils, porous surfaces, or nowadays cell phones, which can transmit the agent if contaminated) (Onakpoya 2022b (opens in a new tab)). Such public health measures were widely adopted during the Spanish flu pandemic and have been the source of considerable debate (Bootsma 2007 (opens in a new tab)).
Why it is important to do this review
Although the benefits of physical interventions seem self‐evident, given the global importance of interrupting respiratory virus transmission, having up‐to‐date estimates of their effectiveness is necessary to inform planning, decision‐making, and policy. The continuance of outbreaks of COVID‐19 and the reporting of several new trials assessing different barrier interventions in preventing the spread of SARS‐COV‐2 virus, have prompted this update (WHO 2022 (opens in a new tab)). Physical methods have several possible advantages over other methods of suppressing ARI outbreaks, including their rapid deployment and ability to be independent of the infective agent, including novel viruses.
The hallmark of the 2020 update was shifting from including all types of studies to a focus on randomised controlled trials (RCTs) only, which had substantially increased in number. This change enabled more robust evidence summaries from high‐quality studies, which are much less prone to the risk of the multiple biases associated with observational studies, to help policy and decision makers in making national and global recommendations. The 2020 update identified 67 relevant studies, but none were carried out during the COVID‐19 pandemic (Jefferson 2020 (opens in a new tab)). The three key messages of that update were: (1) hand hygiene programmes may help to slow the spread of respiratory viruses; (2) uncertainty whether wearing masks or N95/P2 respirators would help in slowing the spread of respiratory viruses; and (3) few studies were identified for other interventions. One study looked at quarantine, and none looked at eye protection, gowns and gloves, or screening people when they entered a country*.* However, during the last search of the 2020 update, six ongoing, unpublished studies were identified; three of them evaluate masks in COVID‐19. The review authors are aware that several trials have now been published since the publication of the 2020 update, warranting this new update.
This is the fifth update (Jefferson 2009 (opens in a new tab); Jefferson 2010 (opens in a new tab); Jefferson 2011 (opens in a new tab); Jefferson 2020 (opens in a new tab)) of a Cochrane Review first published in 2007 (Jefferson 2007 (opens in a new tab)).
Objectives
To assess the effectiveness of physical interventions to interrupt or reduce the spread of acute respiratory viruses.
Methods
Criteria for considering studies for this review
Types of studies
For this 2022 update we only considered individual‐level randomised controlled trials (RCTs), or cluster‐RCTs, or quasi‐RCTs for inclusion.
In versions of this review prior to 2020 we also included observational studies (cohorts, case‐controls, before‐after, and time series studies). However, for this update there were sufficient randomised studies to address our study aims, so we excluded observational studies because randomisation is the optimal method to prevent systematic differences between participants in different intervention groups and, further, deciding who receives an intervention and who does not is influenced by many factors, including prognostic factors (Higgins 2011 (opens in a new tab)). This point is particularly relevant here because individuals who chose to implement physical interventions are likely to use multiple interventions, thus making it difficult to separate out the effect of single interventions. Further, they are likely to be different from individuals who do not implement physical interventions in ways that are difficult to measure.
Types of participants
People of all ages.
Types of interventions
We included RCTs and cluster‐RCTs of trials investigating physical interventions or combinations of interventions to prevent respiratory virus transmission compared with doing nothing or with other interventions. The interventions of interest included: screening at entry ports, isolation, quarantine, physical distancing, personal protection (clothing, gloves, devices), hand hygiene, face masks, gargling, nasal washes, eye protective devices, face shields, disinfecting, and school closure.
Types of outcome measures
For the outcomes listed below we had no predetermined key time points of interest or adverse events of special interest, however, methods of assessment of cases of viral respiratory illness based on laboratory‐confirmation needed to be based on an accurate test in combination with critical additional information. For example, a polymerase chain reaction (PCR) test in combination with symptoms of disease, or a serological test at baseline as well as at the end of follow‐up were acceptable methods. Further, we stratified analyses by study‐specific definitions for cases of viral respiratory illness which included a broad definition of acute respiratory infection (ARI), a more specific definition of influenza‐like‐illness (ILI), and the most precise definition of a laboratory‐confirmed respiratory infection that identified the actual viral pathogen. For the studies conducted during the COVID‐19 pandemic, we assumed that COVID‐like illness was interchangeable with ILI. In the case of laboratory‐confirmed respiratory infection we separated out SARS‐CoV‐2/influenza and other viral pathogens. We did not pool these outcomes as it cannot be assumed that the effects of physical interventions will be the same for the different viral pathogens. The one exception was for the comparison of hand‐hygiene versus control where the estimated effects for ARI, ILI and laboratory‐confirmed infection were highly consistent.
Primary outcomes
Numbers of cases of viral respiratory illness (including acute respiratory infections (ARI), influenza‐like illness (ILI), COVID‐like illness and laboratory‐confirmed influenza, SARS‐CoV‐2 or other viral pathogens). 1. Adverse events related to the intervention.
Secondary outcomes
Deaths. 1. Severity of viral respiratory illness as reported in the studies. 1. Absenteeism. 1. Hospital admissions. 1. Complications related to the illness, e.g. pneumonia.
Search methods for identification of studies
Electronic searches
For this 2022 update, we refined the original search strategy using a combination of previously included studies and automation tools (Clark 2020 (opens in a new tab)). We converted this search using the Polyglot Search Translator (Clark 2020 (opens in a new tab)), and ran the searches in the following databases:
the Cochrane Central Register of Controlled Trials (CENTRAL) (2022, Issue 09), which includes the Acute Respiratory Infections Group's Specialised Register (searched 04 October 2022) (Appendix 1 (opens in a new tab)); 1. PubMed (01 January 2020 to 04 October 2022) (Appendix 2 (opens in a new tab)); 1. Embase (01 January 2020 to 04 October 2022) (Appendix 3 (opens in a new tab)); 1. CINAHL (Cumulative Index to Nursing and Allied Health Literature) (01 January 2020 to 04 October) (Appendix 4 (opens in a new tab)); 1. US National Institutes of Health Ongoing Trials Register ClinicalTrials.gov (January 2010 to 04 October 2022); and 1. World Health Organization International Clinical Trials Registry Platform (January 2010 to 04 October 2022). We combined the database searches with the Cochrane Highly Sensitive Search Strategy for identifying randomised trials in MEDLINE: sensitivity‐ and precision‐maximising version (2008 revision) (Lefebvre 2011 (opens in a new tab)). Details of previous searches are available in Appendix 5 (opens in a new tab).
Searching other resources
We conducted a backwards‐and‐forwards citation analysis in Scopus on all newly included studies to identify other potentially relevant studies.
Data collection and analysis
Selection of studies
The search and citation analysis results were initially screened via the RobotSearch tool (Marshall 2018 (opens in a new tab)) to exclude all studies that were obviously not RCTs. We scanned the titles and abstracts of studies identified by the searches. We obtained the full‐text articles of studies that either appeared to meet our eligibility criteria or for which there was insufficient information to exclude it. We then used a standardised form to assess the eligibility of each study based on the full article.
Data extraction and management
Five review authors (LA/GB/EF/EB/TOJ) independently applied the inclusion criteria to all identified and retrieved articles, and extracted data using a standard template that had been developed for and applied to previous versions of the review, but was revised to reflect our focus on RCTs and cluster‐RCTs for this update. We resolved any disagreements through discussion with either PG or JMC acting as arbiter. We extracted and reported descriptions of interventions using the Template for Intervention Description and Replication (TIDieR) template (Table 1 (opens in a new tab)).
Open in table viewer (opens in a new tab)
Table 1. Description of interventions in included studies, using the items from the Template for Intervention Description and Replication (TIDieR) checklist
ABH: alcohol‐based rub
AGNPs: ARGOVIT silver nanoparticles
ARI: acute respiratory infection
CDC: Centers for Disease Control and Prevention
CG: control group
CHG: chlorhexidine gluconate
CHW: community health worker
CO: carbon monoxide
DCCs: daycare centres
DCT: daily contact testing
FM: face masks
H: handwashing
HCP: healthcare personnel
HCW: healthcare worker
HH: hand hygiene
HSG: hand sanitiser group
HSW: hand‐washing with soap and water
HW: hand‐washing
HWWS: hand‐washing with soap
IG: intervention group
IHIP: integrated environmental home‐based intervention package
ILI: influenza‐like illness
IU: international units
LFD: lateral flow device
LNS: lipid‐based nutrient supplements
LTCFs: long‐term care facilities
m: metre
min: minute
N: nutrition
NGOs: non‐governmental organisations
NH: nursing home
NHS: National Health Service
no.: number
NPIs: non‐pharmaceutical interventions
PCR: polymerase chain reaction
PM2.5: particulate matter of less than 2.5 microns
RAs: research assistants
RIs: respiratory infections
RTIs: respiratory tract infections
S: sanitation
SD: standard deviation
SES: electrolysed water
SSTI: skin and soft‐tissue infection
SWG: soap‐and‐water group
TCID: tissue‐culture infectious dose
URTI: upper respiratory tract infection
W: water
WHO: World Health Organization
wk: week
WSH: combined water, sanitation and handwashing
WSHN: combined water, sanitation, handwashing and nutrition
w/w: weight for weight
[1] Filtration efficiency testing was conducted using a Fluke 985 particle counter (volumetric sampling rate of 2.83 litres/ minute. The measurement was taken of particles 0.3–0.5 μm in diameter flowing through the material with a face velocity of 8.5 cm/s. Internal testing found that cloth masks with an external layer made of Pellon 931 polyester fusible interface ironed onto interlocking knit with a middle layer of interlocking knit could achieve a 60% filtration efficiency. Upon discussions with the manufacturers, the researchers learned that those materials could not be procured. Using materials that were available, the highest filtration efficiency possible was 37%.
[2] “the exterior and interiors were spunbond and the middle layer was meltblown”
[3] 10 times with bar soap and water
[4] Featured the Honorable Prime Minister of Bangladesh Sheikh Hasina, the head of the Imam Training Academy, and the national cricket star Shakib Al Hasan.
[5] A grassroots organization with a network of volunteers across the country
[6] “consistent with the WHO guideline that defines physical distancing as one meter of separation.” www.who.int/westernpacific/emergencies/covid-19/information/physical-distancing (opens in a new tab) (accessed 13 June 2022).
[7] Occupational Safety and Health Administration (OSHA). OSHA technical manual: section VIII: chapter 2: respiratory protection. US Department of Labor. www.osha.gov/dts/osta/otm/otm_viii/otm_viii_2.html (opens in a new tab) (accessed 21 April 2020).
[8] Ministry of Health and Long‐Term Care, Public Health Division, Provincial Infectious Diseases Advisory Committee. Preventing respiratory illnesses: protecting patient and staff: infection control and surveillance standards for febrile respiratory illness (FRI) in non‐outbreak conditions in acute care hospitals [September 2005] http://www.health.gov.on.ca/english/providers/program/infectious/diseases/best_prac/bp_fri_080406.pdf (opens in a new tab) (accessed September 11 2009). [URL inactive]
[9] Before eating, after sneezing, coughing, handling money, using restroom, returning to desk and interacting with others who may be sick
[10] after coming into classroom, before and after lunch, after break, after physical education, when they went home and after coughing, sneezing or blowing their noses
[11] after toileting and when visibly dirty plus a protocol for particular circumstances: after coming into the classroom; before and after lunch; after playing outside; when they went home; after coughing, sneezing, or blowing their noses; and after diapering
[12] 1) when entering into the classroom; 2) after sneezing, coughing, or blowing their nose; 3) after using the toilet/washroom; 4) before eating any food; and 5) when leaving the school at the end of the day
[13] what to do if hands were dirty, why students should wash their hands, benefits of washing hands and using hand sanitiser, procedure for washing hands using hand sanitiser, to cover mouth and nose with upper part of sleeve while coughing and/or sneezing
[14] Boyce JM, Pittet D, Healthcare Infection Control Practices Advisory Committee, HICPAC/ SHEA/APIC/IDSA Hand Hygiene Task Force. Guideline for hand hygiene in healthcare settings. Recommendations of the Healthcare Infection Control Practices Advisory Committee and the HICPAC/SHEA/APIC/ IDSA Hand Hygiene Task Force. MMWR Recommendations and Reports 2002;51(RR‐16):1–45. www.cdc.gov/mmwr/preview/mmwrhtml/rr5116a1.htm (opens in a new tab) (accessed 21 April 2020). International Bank for Reconstruction and Development/ World Bank, Bank‐Netherlands Water Partnership, Water and Sanitation Program. Hand washing manual: a guide for developing a hygiene promotion program to increase handwashing with soap. http://go.worldbank.org/PJTS4A53C0 (opens in a new tab) (Accessed 16 May 2007). [URL inactive] California State Department of Education. Techniques for Preventing the Spread of Infectious Diseases. Sacramento (CA): California State Department of Education, 1983. Geiger BF, Artz L, Petri CJ, Winnail SD, Mason JW. Fun with Handwashing Education. Birmingham (AL): University of Alabama, 2000. Roberts A, Pareja R, Shaw W, Boyd B, Booth E, Mata JI. A tool box for building health communication capacity. www.globalhealthcommunication.org/tools/29 (opens in a new tab) (Accessed 10 October 2007). [URL inactive] Stark P. Handwashing Technique. Instructor’s Packet. Learning Activity Package. Sacramento (CA): California State Department of Education, 1982.
[15] DIN EN 1500: Chemische Desinfektionsmittel und Antiseptika, Hygienische Händedesinfektion, Prüfverfahren und Anforderungen (Phase 2/Stufe 2). Brüssel (Belgium): CEN, European Comittee for Standardization 1997;1‐20.
[16] DIN EN 12791: Chemische Desinfektionsmittel und Antiseptika, Chirugische Händedesinfektionsmittel ‐ Prüfverfahren und Anforderungen (Phase 2/Stufe 2). Brüssel (Belgium): CEN, European Comittee for Standardization 2005;1‐31.
[17] after defaecation, after cleaning an infant who had defaecated, before preparing food, before eating, and before feeding infants
[18] non‐governmental organisation that supports community‐based health and development initiatives
[19] “Healthy Hands” Rules (from Figure 3 in paper): Do use “special soap” when arrive to school, before lunch, after go to bathroom (only if soap and water not available), if rub nose or eyes or if fingers in mouth, if teacher asks. Do not: use “special soap” if hand dirt on them, put “special soap” on another student, play with ‘special soap”, put hands near eyes after using “special soap”.
[20] Calculated by subtracting each day’s soap weight from the previous day’s weight. Maximum number of grams of soap consumed for each compound was identified and the day on which the maximum soap consumption was recorded. A per capita estimate of daily soap consumption was calculated
[21] National Health and Medical Research Council. Staying Healthy in Child Care. Canberra (Australia): Australian Government Publishing Service, 1994
[22] upon arrival, before and after lunch, and prior to departure
[23] World Health Organization. (2012). Hand hygiene in outpatient and home‐based care and long‐term care facilities: a guide to the application of the WHO multimodal hand hygiene improvement strategy and the “My Five Moments For Hand Hygiene” approach. World Health Organization. apps.who.int/iris/handle/10665/78060 (opens in a new tab) (accessed 15 June 2022)
[24] Moment 1 (before touching a resident) = Room In; Moment 4 (after touching a resident) and Moment 5 (after touching a resident’s surroundings) = Room Out; Moment 2 (before a clean/antiseptic procedure) = Before Clean; Moment 3 (after body fluid exposure risk) – After Dirty
[25] Handsome: handhygiëne in verpleeghuizen.: Zorg voor beter; 2019 May 03. URL: www.zorgvoorbeter.nl/handsome (opens in a new tab) (accessed 7 June 2022)
[26] Veiligheid en Kwaliteit: Project Handen uit de Mouwen.: Stichting Samenwerkende Rijnmond Ziekenhuizen
[27] Auditor training.: Hand Hygiene Australia URL: www.hha.org.au/audits/auditor-training (opens in a new tab) (accessed 7 June 2022)
[28] no long nails, acrylic nails, or polished nails and not wearing a ring, bracelet, wristwatch, brace, or long sleeves.
[29] Persoonlijke hygiëne: Verpleeghuizen, woonzorgcentra, voorzieningen voor kleinschalig wonen voor ouderen.: Werkgroep Infectie Preventie; 2014. URL: tinyurl.com/wpfqr8p (opens in a new tab) (accessed 7 June 2022)
[30] knowledge and awareness of HH guidelines, perceived importance of performing HH, perceived behavioural control (i.e. perceived ease or difficulty of performing the behaviour), and habit
[31] “According to the Dutch national guidelines, HH is mandatory for caregivers before touching/preparing food, before caregivers themselves ate or assisted children with eating, and before wound care; and after diapering, after toilet use/wiping buttocks, after caregivers themselves coughed/sneezed/wiped their own nose, after contact with body fluids (e.g. saliva, vomit, urine, blood, or mucus when wiping children’s noses), after wound care, and after hands were visibly soiled.” (p. 2495)
[32] Having touched household items being used by the index patients and/or other symptomatic household contacts, and after coughing/sneezing, before meals, before preparing meals and when returning home
[33] Which addresses “contextual, psychosocial, and technological factors at the societal, community, interpersonal, individual, and habitual levels”. (Luby 2018)
[34] Hussain F, Luby SP, Unicomb L, Leontsini E, Naushin T, Buckland AJ, et al. Assessment of the acceptability and feasibility of child potties for safe child feces disposal in rural Bangladesh. The American Journal of Tropical Medicine and Hygiene. 2017;97: 469–76.
[35] Sultana R, Mondal UK, Rimi NA, Unicomb L, Winch PJ, Nahar N, et al. An improved tool for household faeces management in rural Bangladeshi communities. Tropical Medicine & International health 2013;18: 854–60.
[36] Hulland KR, Leontsini E, Dreibelbis R, Unicomb L, Afroz A, Dutta NC, et al. Designing a handwashing station for infrastructure‐restricted communities in Bangladesh using the integrated behavioural model for water, sanitation and hygiene interventions (IBM‐WASH). BMC Public Health 2013; 13: 877.
[37] Menon P, Nguyen PH, Saha KK, Khaled A, Sanghvi T, Baker J, et al. Combining intensive counseling by frontline workers with a nationwide mass media campaign has large differential impacts on complementary feeding practices but not on child growth: results of a cluster‐randomized program evaluation in Bangladesh. The Journal of Nutrition 2016;146:2075–84.
[38] comprised of: senior program manager‐intervention delivery, senior program manager‐operations, Sanitation Intervention Team leader, senior field research officer, training officer, field research officers, CHW supervisors and CHWs
[39] SODIS: www.sodis.ch/index_EN.html (opens in a new tab)
[40] after defecation, after changing diapers, before food preparation and before eating
[41] 1. Wash both hands with water and soap before eating/ handling food 2. Wash both hands with water and soap/ash after defecation 3. Wash both hands with water and soap/ash after cleaning baby’s bottom 4. Use hygienic latrine by all family members including Children 5. Dispose of children’s faeces into hygienic latrines 6. Clean and maintain latrine 7. Construct a new latrine if the existing one is full and fill the pit with soil/ash. 8. Safe collection and storage of drinking water 9. Draw drinking water from arsenic safe water point 10. Wash raw fruits and vegetables with safe water before eating and cover food properly 11. Manage menstruation period safely (p.605)
[42] Rosenstock IM, Strecher VJ, Becker MH. Social learning theory and the Health Belief Model. Health Education Quarterly 1988;15:175–83.
[43] Glanz K, Rimer BK, 2005. Theory at a Glance: A Guide for Health Promotion Practice. Washington, DC:US Department of Health and Human Services, Public Health Service, National Institutes of Health, National Cancer Institute.
[44] Hovland CI, Janis IL, Kelley HH, 1953. Communication and Persuasion; Psychological Studies of Opinion Change. New Haven, CT: Yale University Press.
[45] Based on family of five, consuming 2L of water per person per day, the bottle would last almost a year
[46] W: key concepts for water treatment and contamination, procedures for refilling dispenser and distributing bottled chlorine, chlorine testing and reporting; H: HW with soap at critical times and creating supportive environment; S: contamination pathways; N: early initiation and exclusive breastfeeding, complementary and supplementary feeding, LNS procedures for collection from health facility and delivery tracking, teaching mamas how to feed Mwanzobora to the child, cooking demonstration, age‐specific messaging about nutrition
[47] Department of Health and Social Care. Lateral flow device performance data. July 7, 2021. www.gov.uk/government/publications/lateral-flow-device-performance-data (opens in a new tab) (accessed 15 June 2022).
[48] “applicable to schools as defined in national guidelines were, face to face contact (within 1 metre for any length of time) or skin to skin contact or someone the case coughed on; or within 1 metre for ≥1 minute; or within 1‐2 metres for >15 minutes.” P.2 of Supplementary appendix
[49] i.e., surgical uniform, N95 mask, eye‑sealing glasses and plastic wallet, disposable cap, latex gloves, rubber footwear for hospital use and disposable shoe covers, while working. Additionally, third level care health professionals wore a full protective mask, Dermacare®, overalls with zipper, and an integrated hood with elastic hand and ankle cuffs, double disposable boot covers and double latex gloves.
[50] With liquid soap (2% chlorhexidine gluconate) and hand disinfection (0.05% chlorhexidine gluconate and 60‑80% ethyl alcohol).
[51] With 80% ethyl alcohol
Assessment of risk of bias in included studies
Four review authors (EF/EB/GB/MJ) independently assessed risk of bias for the method of random sequence generation and allocation concealment (selection bias), blinding of participants and personnel (performance bias), blinding of outcome assessment (detection bias), outcome reporting (attrition bias), and selective reporting (reporting bias). In addition, for the cluster trials, we assessed selection bias due to how recruitment of participants was conducted. Participants should be identified before the cluster is randomised or, if not, recruitment should be by someone masked to the cluster allocation. Further, we considered whether there were sufficient numbers of clusters in each treatment group to ensure comparable groups, and excluded one study from the analysis due to insufficient number of clusters. We used the Cochrane risk of bias tool to assess risk of bias, classifying each risk of bias domain as 'low', ‘high’, or ‘unclear’. The following were indications for low risk of bias:
method of random sequence generation: the method was well‐described and is likely to produce balanced and truly random groups; 1. allocation concealment: the next treatment allocation was not known to participant/cluster or treating staff until after consent to join the study; 1. blinding of participants and personnel: the method is likely to maintain blinding throughout the study; 1. blinding of outcome assessors: all outcome assessors were unaware of treatment allocation; 1. outcome reporting: participant attrition throughout the study is reported, and reasons for loss are appropriately described; and 1. selective reporting: all likely planned and collected outcomes have been reported.
Measures of treatment effect
When possible, we performed meta‐analysis and summarised effectiveness as risk ratio (RR) using 95% confidence intervals (CIs). For studies that could not be pooled, we used the effect measures reported by the trial authors (such as RR or incidence rate ratio (IRR) with 95% CI or, when these were not available, relevant P values). Where multiple analyses were reported on the same outcome we chose the analysis based on preferences for: (1) an adjusted analysis (over an unadjusted analysis), and (2) an analysis based on a longer follow‐up period, or a greater number of outcomes events.
Unit of analysis issues
Many of the included studies were cluster‐RCTs. To avoid any unit of analysis issues, we only included treatment effect estimates that were based on methods that were appropriate for the analysis of cluster trials, such as mixed models and generalised estimating equations. Given this restriction, we used the generalised inverse‐variance method of meta‐analysis. Some cluster‐RCTs that did not report cluster‐adjusted treatment effects provided sufficient data (number of events and participants by treatment group and intraclass correlations) for us to calculate appropriate treatment effect estimates and standard errors using the methods described in the Cochrane Handbook for Systematic Reviews of Interventions (Higgins 2021a (opens in a new tab)). For studies with multiple treatment groups but only one control group, where appropriate, we adjusted standard errors upwards to avoid unit of analysis errors in the meta‐analyses. We did this by splitting the control group into equal sized groups and adjusting standard errors upwards to account for the reduced sample size of the control subgroups (Higgins 2021b (opens in a new tab)).
Dealing with missing data
Previously, whenever details of studies were unclear, or studies were only known to us by abstracts or communications at meetings, we corresponded with first or corresponding authors. For this 2022 review, we did not contact authors of studies.
Assessment of heterogeneity
Aggregation of data was dependent on types of comparisons, sensitivity and homogeneity of definitions of exposure, populations and outcomes used. We calculated the I²statistic and Chi² test for each pooled estimate to assess the presence of statistical heterogeneity (Higgins 2002 (opens in a new tab); Higgins 2003 (opens in a new tab)).
Assessment of reporting biases
Given the widely disparate nature of our evidence base, we limited our assessment of possible reporting biases to funnel plot visual inspection if we had > 10 included studies for any single meta‐analysis.
Data synthesis
If possible and appropriate, we combined studies in a meta‐analysis. We used the generalised inverse‐variance random‐effects model where cluster‐RCTs were included in the analysis. We chose the random‐effects model because we expected clinical heterogeneity due to differences in pooled interventions and outcome definitions, and methodological heterogeneity due to pooling of RCTs and cluster‐RCTs.
Subgroup analysis and investigation of heterogeneity
We conducted one post hoc subgroup analyses of adults (18 years +) versus children (0 to 18 years) for the comparison of hand hygiene versus control.
We did not conduct further investigation of heterogeneity due to insufficient numbers of studies included in the comparisons.
Sensitivity analysis
We conducted a sensitivity analysis for hand hygiene versus control where we included the most precise and unequivocal measure of viral respiratory illness reported for each included study.
Summary of findings and assessment of the certainty of the evidence
We created three summary of findings tables using the following outcomes: numbers of cases of viral respiratory illness (including ARIs, ILI, COVID‐like illness and laboratory‐confirmed influenza/SARS‐CoV‐2 or other respiratory viruses), and adverse events related to the intervention (summary of findings Table 1 (opens in a new tab); summary of findings Table 2 (opens in a new tab); summary of findings Table 3 (opens in a new tab)). We planned to include the secondary outcomes of deaths; severity of viral respiratory illness as reported in the studies; absenteeism; hospital admissions; and complications related to the illness (e.g. pneumonia). However, these data were poorly reported in the included studies. We used the five GRADE considerations (study limitations, consistency of effect, imprecision, indirectness, and publication bias) to assess the certainty of evidence as it related to the studies which contributed data to the meta‐analyses for the prespecified outcomes (Atkins 2004 (opens in a new tab)). We used the methods and recommendations described in Section 8.5 and Chapter 12 of the Cochrane Handbook for Systematic Reviews of Interventions (Higgins 2011 (opens in a new tab)), employing GRADEpro GDT software (GRADEpro GDT (opens in a new tab)). We justified all decisions to down‐ or upgrade the certainty of the evidence in footnotes, and made comments to aid the reader's understanding of the review where necessary.
Results
Description of studies
See Characteristics of included studies (opens in a new tab) and Characteristics of excluded studies (opens in a new tab) tables. Five trials were funded by government and pharmaceutical companies (Aiello 2010 (opens in a new tab); Aiello 2012 (opens in a new tab); Chard 2019 (opens in a new tab); Yeung 2011 (opens in a new tab); Zomer 2015 (opens in a new tab)), and nine trials were funded by pharmaceutical companies (Arbogast 2016 (opens in a new tab); Carabin 1999 (opens in a new tab); Luby 2005 (opens in a new tab); Nicholson 2014 (opens in a new tab); Sandora 2005 (opens in a new tab); Sandora 2008 (opens in a new tab); Turner 2004a (opens in a new tab); Turner 2004b (opens in a new tab); Turner 2012 (opens in a new tab)).
Results of the search
For this 2022 update we found 2667 records through database and trial registry searching, as well as 738 record through citation searching. After removing duplicates we had 2936 records that underwent title and abstract screening.
We identified a total of 202 titles in this 2022 update. We excluded 180 titles and retrieved the full papers of 35 studies, to include 11 new studies. See Figure 1 (opens in a new tab).

Study flow diagram.
Included studies
In this 2022 update we included 11 new studies (610,872 participants); randomised controlled trials (RCTs) (n = 5) or cluster‐RCTs (n = 6) published between 2020 and 2022. In total 78 studies are included in this review update. For detailed descriptions of the interventions of the included studies, see Table 1 (opens in a new tab).
Eighteen trials focused on using masks (Abaluck 2022 (opens in a new tab); Aiello 2010 (opens in a new tab); Aiello 2012 (opens in a new tab); Alfelali 2020 (opens in a new tab); Barasheed 2014 (opens in a new tab); Bundgaard 2021 (opens in a new tab); Canini 2010 (opens in a new tab); Cowling 2008 (opens in a new tab); Ide 2016 (opens in a new tab); Jacobs 2009 (opens in a new tab); Loeb 2009 (opens in a new tab); MacIntyre 2009 (opens in a new tab); MacIntyre 2011 (opens in a new tab); MacIntyre 2013 (opens in a new tab); MacIntyre 2015 (opens in a new tab); MacIntyre 2016 (opens in a new tab); Radonovich 2019 (opens in a new tab); Suess 2012 (opens in a new tab)). Thirteen of the 18 trials compared medical/surgical masks to no mask (control) (Abaluck 2022 (opens in a new tab); Aiello 2010 (opens in a new tab); Aiello 2012 (opens in a new tab); Alfelali 2020 (opens in a new tab); Barasheed 2014 (opens in a new tab); Bundgaard 2021 (opens in a new tab); Canini 2010 (opens in a new tab); Cowling 2008 (opens in a new tab); Jacobs 2009 (opens in a new tab); MacIntyre 2009 (opens in a new tab); MacIntyre 2015 (opens in a new tab); MacIntyre 2016 (opens in a new tab); Suess 2012 (opens in a new tab)). One study compared catechin‐treated masks to no mask (Ide 2016 (opens in a new tab)), and one study included cloth masks versus control (third arm in MacIntyre 2015 (opens in a new tab)). Three of the 18 trials were in healthcare workers (Ide 2016 (opens in a new tab); Jacobs 2009 (opens in a new tab); MacIntyre 2015 (opens in a new tab)), whilst the remaining trials were in non‐healthcare workers (students, households, families, or pilgrims). Only one trial was conducted during the H1N1 pandemic season (Suess 2012 (opens in a new tab)), and two trials were conducted during the SARS‐CoV‐2 pandemic (Abaluck 2022 (opens in a new tab); Bundgaard 2021 (opens in a new tab)).
Five of the 18 trials compared N95 masks or P2 masks to medical/surgical masks (Loeb 2009 (opens in a new tab); MacIntyre 2009 (opens in a new tab); MacIntyre 2011 (opens in a new tab); MacIntyre 2013 (opens in a new tab); Radonovich 2019 (opens in a new tab)). All of these trials, except for one study that was conducted on household individuals (MacIntyre 2009 (opens in a new tab)), included healthcare workers either in a hospital setting, Loeb 2009 (opens in a new tab); MacIntyre 2011 (opens in a new tab); MacIntyre 2013 (opens in a new tab), or an outpatient setting (MacIntyre 2009 (opens in a new tab); Radonovich 2019 (opens in a new tab)).
One trial evaluated the effectiveness of quarantining workers of one of two sibling companies in Japan whose family members had developed an influenza‐like illness (ILI) during the 2009 to 2010 H1N1 influenza pandemic (Miyaki 2011 (opens in a new tab)). Another trial conducted during the SARS‐CoV‐2 pandemic in Norway investigated fitness centre access with physical distancing compared to no access (Helsingen 2021 (opens in a new tab)); and one cluster trial compared daily testing for contacts of individuals with SARS‐CoV‐2 compared to self‐isolation at home in English secondary schools (Young 2021 (opens in a new tab)).
Nineteen trials compared hand hygiene interventions with no hand hygiene (control) and provided data suitable for meta‐analysis. The populations in these trials included adults, children, and families, in settings such as schools (Biswas 2019 (opens in a new tab); Stebbins 2011 (opens in a new tab)), childcare centres (Azor‐Martinez 2018 (opens in a new tab); Correa 2012 (opens in a new tab); Roberts 2000 (opens in a new tab); Zomer 2015 (opens in a new tab)), homes/households (Cowling 2008 (opens in a new tab); Cowling 2009 (opens in a new tab); Larson 2010 (opens in a new tab); Little 2015 (opens in a new tab); Nicholson 2014 (opens in a new tab); Ram 2015 (opens in a new tab); Sandora 2005 (opens in a new tab); Simmerman 2011 (opens in a new tab)), offices (Hubner 2010 (opens in a new tab)), military trainees (Millar 2016 (opens in a new tab)), villages (Ashraf 2020 (opens in a new tab); Swarthout 2020 (opens in a new tab)), and nursing homes (Teesing 2021 (opens in a new tab)). None of the trials were conducted during a pandemic, although some of the studies were conducted during peak influenza seasons.
A further 10 trials that compared a variety of hand hygiene modalities to control provided insufficient information to include in meta‐analyses. Three trials were in children: one was conducted in daycare centres in Denmark examining a multimodal hygiene programme (Ladegaard 1999 (opens in a new tab)), and two trials compared a hand hygiene campaign or workshop in an elementary school environment in Saudi Arabia, Alzaher 2018 (opens in a new tab), and Egypt, Talaat 2011 (opens in a new tab). Three trials tested virucidal hand treatment in an experimental setting, Gwaltney 1980 (opens in a new tab); Turner 2004a (opens in a new tab), and in a community, Turner 2012 (opens in a new tab), in the USA. Feldman 2016 (opens in a new tab) compared hand‐washing with chlorhexidine gluconate amongst Israeli sailors. One trial compared hand sanitiser packaged in a multimodal hygiene programme amongst office employees in the USA (Arbogast 2016 (opens in a new tab)). Two trials were conducted in a long‐term facility setting: one trial examined the effect of a bundled hand hygiene programme on infectious risk in nursing home residents in France (Temime 2018 (opens in a new tab)), and the other trial compared the effect of using hand sanitisers in healthcare workers on the rate of infections (including respiratory infections) in nursing home residents in Hong Kong (Yeung 2011 (opens in a new tab)).
Five trials compared different hand hygiene interventions in a variety of settings such as schools (Morton 2004 (opens in a new tab), in kindergartens and elementary schools in the USA; Priest 2014 (opens in a new tab), in primary schools in New Zealand; and Pandejpong 2012 (opens in a new tab) in kindergartens in Thailand). One study was conducted in low‐income neighbourhoods in Karachi, Pakistan (Luby 2005 (opens in a new tab)), and one was conducted in a workplace environment in Finland (Savolainen‐Kopra 2012 (opens in a new tab)). A variety of interventions were used across these trials such as soap and water (Luby 2005 (opens in a new tab); Savolainen‐Kopra 2012 (opens in a new tab)), hand sanitiser (Morton 2004 (opens in a new tab); Pandejpong 2012 (opens in a new tab); Priest 2014 (opens in a new tab); Savolainen‐Kopra 2012 (opens in a new tab)), body wash (Luby 2005 (opens in a new tab)), and alcohol‐based hand wipes (Morton 2004 (opens in a new tab)), with or without additional hygiene education. There was considerable variation in interventions, and the information in the trial reports was insufficient to permit meta‐analysis.
Seven trials compared a combined intervention of hand hygiene and face masks with control. Four of these trials were carried out in households in Germany (Suess 2012 (opens in a new tab)), Thailand (Simmerman 2011 (opens in a new tab)), Hispanic immigrant communities in the USA (Larson 2010 (opens in a new tab)), and households in Hong Kong (Cowling 2009 (opens in a new tab)). Two trials were conducted amongst university student residences (Aiello 2010 (opens in a new tab); Aiello 2012 (opens in a new tab)), and two trials in groups of pilgrims at the annual Hajj (Aelami 2015 (opens in a new tab); Alfelali 2020 (opens in a new tab)). Moreover, six trials evaluated the incremental benefit of combining surgical masks in addition to hand hygiene with soap (Simmerman 2011 (opens in a new tab)), hand sanitiser (Aiello 2010 (opens in a new tab); Aiello 2012 (opens in a new tab); Larson 2010 (opens in a new tab); Suess 2012 (opens in a new tab)), or both (Cowling 2009 (opens in a new tab)), versus mask or hand hygiene alone on the outcomes of ILI and influenza. Aelami 2015 (opens in a new tab) investigated a hygienic package (alcohol‐based hand rub (gel or spray), surgical masks, soap, and paper handkerchiefs) with a control group.
Seven trials compared a multimodal combination of hand hygiene and disinfection of surfaces, toys, linen, or other components of the environment with a control (Ban 2015 (opens in a new tab); Carabin 1999 (opens in a new tab); Ibfelt 2015 (opens in a new tab); Kotch 1994 (opens in a new tab); McConeghy 2017 (opens in a new tab); Sandora 2008 (opens in a new tab); White 2001 (opens in a new tab)). Variation in scope and type of interventions and insufficient data in trial reports precluded meta‐analysis. All studies except for one were in children (McConeghy 2017 (opens in a new tab)), which was in a nursing home population).
Three trials included in two papers investigated the role of virucidal tissues in interrupting transmission of naturally occurring respiratory infections in households (Farr 1988a (opens in a new tab); Farr 1988b (opens in a new tab); Longini 1988 (opens in a new tab)). Four cluster‐RCTs implemented complex, multimodal sanitation, education, cooking, and hygiene interventions (Chard 2019 (opens in a new tab); Hartinger 2016 (opens in a new tab); Huda 2012 (opens in a new tab); Najnin 2019 (opens in a new tab)). All four of these trials were conducted in low‐income countries in settings with minimal to no access to basic sanitation.
Three trials assessed the effect of gargling on the incidence of upper respiratory tract infections (URTIs) or influenza: gargling with povidone‐iodine (Satomura 2005 (opens in a new tab)), green tea (Ide 2014 (opens in a new tab)), and tap water (Goodall 2014 (opens in a new tab)). Two trials investigated the use of mouth/nasal washes on the incidence of SARS‐CoV‐2 infection in healthcare workers during the COVID‐19 pandemic (Almanza‐Reyes 2021 (opens in a new tab); Gutiérrez‐García 2022 (opens in a new tab)). One trial investigated the use of glasses against the transmission of SARS‐CoV‐2 (Fretheim 2022a (opens in a new tab)).
Ongoing studies
We identified four ongoing studies during the course of the COVID‐19 pandemic, of which one is completed, but unreported (NCT04471766 (opens in a new tab)). The trials evaluated masks concurrent with the COVID‐19 pandemic. Three trials on other interventions are ongoing (Brass 2021 (opens in a new tab); NCT03454009 (opens in a new tab); NCT04267952 (opens in a new tab)).
Studies awaiting classification
We identified five studies awaiting classification (Contreras 2022 (opens in a new tab); Croke 2022 (opens in a new tab); Delaguerre 2022 (opens in a new tab); Loeb 2022 (opens in a new tab); Varela 2022 (opens in a new tab)).
A previous RCT (NCT04296643) reported as ongoing in the last version has now been recently published but was not able to be included in the summary of findings pooled results (Loeb 2022 (opens in a new tab)). In a multicentre, randomised non‐inferiority trial of 1009 healthcare workers (HCWs) across four countries randomised to medical mask versus fit‐tested N95 respirators for direct care of COVID‐19 patients or long‐term care residents, laboratory‐confirmed SARS‐CoV‐2 was found in 10.46% (52/497) versus 9.27% (47/507) in the medical/surgical mask group and fit‐tested N95 respirator group (hazard ratio 1.14 (95% CI 0.77 to 1.69), respectively. There was a 1.19% absolute increase in risk of COVID‐19 with medical masks versus N95 respirator 95% CI (‐2.5% to 4.9%). There were 47 (10.8%) adverse events related to the intervention reported in the medical mask group and 59 (13.6%) in the N95 respirator group. The use of medical masks was found to be non‐inferior to N95 respirators in the direct care of COVID‐19 patients and the study crossed over into the more transmissible Omicron variant period of the COVID‐19 pandemic.
Excluded studies
We excluded a total of 180 studies. We identified 20 new studies for exclusion at the data extraction stage of this 2022 update, all of which appeared to be eligible at screening. Five of the 20 studies were ineligible due to evaluating treatments for patients with disease (Cyril Vitug 2021 (opens in a new tab); Ferrer 2021 (opens in a new tab); Meister 2022 (opens in a new tab); Sanchez Barrueco 2022 (opens in a new tab); Sevinc Gul 2022 (opens in a new tab)), two were excluded because they did not assess clinical outcomes (Costa 2021 (opens in a new tab); Seneviratne 2021 (opens in a new tab)), four were excluded due to not assessing viral outcomes (Gharebaghi 2020 (opens in a new tab); Giuliano 2021 (opens in a new tab); Karakaya 2021 (opens in a new tab); Kawyannejad 2020 (opens in a new tab)), five were excluded as they were experiments that did not measure any of our outcomes of interest (Ahmadian 2022 (opens in a new tab); Dalakoti 2022 (opens in a new tab); Egger 2022 (opens in a new tab); Malaczek 2022 (opens in a new tab); Montero‐Vilchez 2022 (opens in a new tab)); three were excluded because they were not RCTs (Chen 2022 (opens in a new tab); Lim 2022 (opens in a new tab); Mo 2022 (opens in a new tab)), and one was excluded as it was a report of another study (Munoz‐Basagoiti 2022 (opens in a new tab)).
Risk of bias in included studies
The overall risk of bias is presented graphically in Figure 2 (opens in a new tab) and summarised by included study in Figure 3 (opens in a new tab). Details on the judgements can be found in the descriptions of individual included studies (Characteristics of included studies (opens in a new tab) table). Out of 78 included studies, only two were rated as low risk of bias for all domains. One of those studies compared two different types of masks (Radonovich 2019 (opens in a new tab)), and the other compared hand sanitiser to no treatment (Turner 2012 (opens in a new tab)). Notably, neither of these two studies was blinded, however, trial procedures were sufficiently robust that the risk of performance bias was low. Overall,approximately only 20% of the studies were rated as low risk of performance bias. This risk of bias domain was particularly problematic because most interventions studied could not be blinded from participants and/or investigators. The two risks of bias domains that were rated the least problematic were attrition bias and random sequence generation where around 50% of studies were rated as low risk of bias. Allocation concealment, blinded outcome assessment and selective reporting were rated as low risk of bias for around 40% of the included studies. Many of the included studies were cluster‐RCTs where the randomisation process was not well reported leading to ratings of unclear risk of bias.

'Risk of bias' graph: review authors' judgements about each risk of bias item presented as percentages across all included trials.

'Risk of bias' summary: review authors' judgements about each risk of bias item for each included trial.
Allocation
For this 2022 review, 10 of the 11 newly included studies provided adequate information on randomisation and were judged to have low risk of bias (Abaluck 2022 (opens in a new tab); Alfelali 2020 (opens in a new tab); Almanza‐Reyes 2021 (opens in a new tab); Ashraf 2020 (opens in a new tab); Bundgaard 2021 (opens in a new tab); Fretheim 2022a (opens in a new tab); Helsingen 2021 (opens in a new tab); Swarthout 2020 (opens in a new tab); Teesing 2021 (opens in a new tab); Young 2021 (opens in a new tab)). Six of these studies described the use of a computerised random number generator (Almanza‐Reyes 2021 (opens in a new tab); Bundgaard 2021 (opens in a new tab); Helsingen 2021 (opens in a new tab); Swarthout 2020 (opens in a new tab); Teesing 2021 (opens in a new tab); Young 2021 (opens in a new tab)). Almanza‐Reyes 2021 (opens in a new tab) described the use of computer‐generated stratified block scheme, while Bundgaard 2021 (opens in a new tab) reported the use of a computer algorithm stratified by the five regions of Denmark. In Fretheim 2022a (opens in a new tab), the investigators used a digital platform (Nettskjema) for recruitment, randomisation and allocation. Three studies mentioned the use of a random number generator, with no additional specifics (Helsingen 2021 (opens in a new tab); Swarthout 2020 (opens in a new tab); Teesing 2021 (opens in a new tab)), while Young 2021 (opens in a new tab) mentioned that randomisation was performed in blocks of two and stratified using nine strata to ensure a sample representative of schools and colleges in England. Abaluck 2022 (opens in a new tab) reported pairwise cross randomisation, whilst Ashraf 2020 (opens in a new tab) reported using a block random number generator. Alfelali 2020 (opens in a new tab) described using coin‐tossing by an individual who was not a member of the research team (i.e. a fellow pilgrim who was not a participant in the trial, a tour operator, or a medical volunteer). One study provided insufficient information to judge the sequence generation bias (Gutiérrez‐García 2022 (opens in a new tab)).
The success of randomisation was judged as low risk of bias in one study only that used an off‐site investigator to allocate groups (Ashraf 2020 (opens in a new tab)). Four new studies provided insufficient information to make a judgment on the adequacy of the process (Bundgaard 2021 (opens in a new tab); Swarthout 2020 (opens in a new tab); Teesing 2021 (opens in a new tab); Young 2021 (opens in a new tab)). The remaining six newly included studies were judged as high risk of allocation bias (Abaluck 2022 (opens in a new tab); Alfelali 2020 (opens in a new tab); Almanza‐Reyes 2021 (opens in a new tab); Fretheim 2022a (opens in a new tab); Gutiérrez‐García 2022 (opens in a new tab); Helsingen 2021 (opens in a new tab)). In Abaluck 2022 (opens in a new tab), there was a significant difference in the numbers of households included in each treatment group, suggestive of a lack of allocation concealment. Alfelali 2020 (opens in a new tab) used coin tossing, which can lead to a large imbalance. In Almanza‐Reyes 2021 (opens in a new tab) baseline prognostic factors (vaccination and frequency of handwashing) were unbalanced between the two arms. In Fretheim 2022a (opens in a new tab), a higher number of participants used face masks in the intervention group. In Gutiérrez‐García 2022 (opens in a new tab) there as a significant age difference between the two groups. Helsingen 2021 (opens in a new tab) described assigning the randomised sequence by a member of the research team, with no further description.
For the review published in 2020, information on sequence generation was overall poorly reported in most of the included studies. Nineteen of the included studies provided adequate information on the randomisation scheme and were judged as at low risk of bias (Aiello 2012 (opens in a new tab); Azor‐Martinez 2016 (opens in a new tab); Azor‐Martinez 2018 (opens in a new tab); Biswas 2019 (opens in a new tab); Canini 2010 (opens in a new tab); Correa 2012 (opens in a new tab); Ide 2014 (opens in a new tab); MacIntyre 2015 (opens in a new tab); MacIntyre 2016 (opens in a new tab); Millar 2016 (opens in a new tab); Najnin 2019 (opens in a new tab); Radonovich 2019 (opens in a new tab); Ram 2015 (opens in a new tab); Simmerman 2011 (opens in a new tab); Stebbins 2011 (opens in a new tab); Suess 2012 (opens in a new tab); Talaat 2011 (opens in a new tab); Turner 2012 (opens in a new tab); Zomer 2015 (opens in a new tab)). Nine studies described the use of computerised sequence generation program/software (Aiello 2012 (opens in a new tab); Azor‐Martinez 2018 (opens in a new tab); Biswas 2019 (opens in a new tab); Canini 2010 (opens in a new tab); Millar 2016 (opens in a new tab); Najnin 2019 (opens in a new tab); Radonovich 2019 (opens in a new tab); Talaat 2011 (opens in a new tab); Turner 2012 (opens in a new tab)). One study used random number tables for sequence generation (Azor‐Martinez 2016 (opens in a new tab)). Three studies described using the random function in Microsoft Excel (Microsoft Excel 2018 (opens in a new tab)) (Correa 2012 (opens in a new tab); MacIntyre 2016 (opens in a new tab); Suess 2012 (opens in a new tab)). Two studies used statistical software to generate a randomisation allocation (MacIntyre 2015 (opens in a new tab); Priest 2014 (opens in a new tab)). Two studies reported using block randomisation: Ram 2015 (opens in a new tab) used block randomisation, and an independent investigator‐generated the list of random assignments, whilst Simmerman 2011 (opens in a new tab) performed block randomisation. Stebbins 2011 (opens in a new tab) used constrained randomisation, and Zomer 2015 (opens in a new tab) reported using stratified randomisation by means of computer generation with a 1:1 ratio in each of the strata.
Fourteen studies reported insufficient information to permit a judgement on the adequacy of the process to minimise selection bias (Aelami 2015 (opens in a new tab); Alzaher 2018 (opens in a new tab); Arbogast 2016 (opens in a new tab); Barasheed 2014 (opens in a new tab); Chard 2019 (opens in a new tab); DiVita 2011 (opens in a new tab); Feldman 2016 (opens in a new tab); Hubner 2010 (opens in a new tab); Ibfelt 2015 (opens in a new tab); McConeghy 2017 (opens in a new tab); Miyaki 2011 (opens in a new tab); Pandejpong 2012 (opens in a new tab); Savolainen‐Kopra 2012 (opens in a new tab); Yeung 2011 (opens in a new tab)). Six studies provided some description about sequence generation, but it was still unclear (Hartinger 2016 (opens in a new tab); Huda 2012 (opens in a new tab); Ide 2016 (opens in a new tab); Little 2015 (opens in a new tab); MacIntyre 2011 (opens in a new tab); MacIntyre 2013 (opens in a new tab)). Huda 2012 (opens in a new tab) mentioned random number tables, but it was unclear if this was for random selection or randomisation. Ide 2016 (opens in a new tab) used computer‐generated randomisation, but the method was not stated. Hartinger 2016 (opens in a new tab) used covariate‐constrained randomisation, but the method was not described. In Little 2015 (opens in a new tab), participants were automatically randomly assigned by the intervention software, but the sequence generation was not described. Two studies used a secure computerised randomisation program (MacIntyre 2011 (opens in a new tab); MacIntyre 2013 (opens in a new tab)), but the sequence generation was not described.
Three of the studies included in the 2020 review, were poorly randomised (Ban 2015 (opens in a new tab); Nicholson 2014 (opens in a new tab); Temime 2018 (opens in a new tab)). Ban 2015 (opens in a new tab) included only two clusters, and the randomisation scheme was not reported. Nicholson 2014 (opens in a new tab) used coin tossing, which can lead to a large imbalance. Temime 2018 (opens in a new tab) used “simple randomisation” with no further description.
For the RCTs included in previous versions of the review, three were poorly reported with no description of randomisation sequence or concealment of allocation (Gwaltney 1980 (opens in a new tab); Turner 2004a (opens in a new tab); Turner 2004b (opens in a new tab)). The quality of the cluster‐RCTs varied, with four studies not providing a description of the randomisation procedure (Carabin 1999 (opens in a new tab); Kotch 1994 (opens in a new tab); Morton 2004 (opens in a new tab); White 2001 (opens in a new tab)). We rated seven studies as at low risk of bias for sequence generation (Cowling 2008 (opens in a new tab); Cowling 2009 (opens in a new tab); Luby 2005 (opens in a new tab); Roberts 2000 (opens in a new tab); Sandora 2005 (opens in a new tab); Sandora 2008 (opens in a new tab); Satomura 2005 (opens in a new tab)), and a further six studies as at unclear risk of bias (Farr 1988a (opens in a new tab); Farr 1988b (opens in a new tab); Ladegaard 1999 (opens in a new tab); Loeb 2009 (opens in a new tab); Longini 1988 (opens in a new tab); MacIntyre 2009 (opens in a new tab)).
Many of the newly included cluster‐RCTs did not report adequately on allocation concealment. Twenty‐one of these studies reported adequate allocation and were judged as at low risk of bias (Aiello 2012 (opens in a new tab); Alzaher 2018 (opens in a new tab); Azor‐Martinez 2016 (opens in a new tab); Azor‐Martinez 2018 (opens in a new tab); Biswas 2019 (opens in a new tab); Canini 2010 (opens in a new tab); Chard 2019 (opens in a new tab); Goodall 2014 (opens in a new tab); Ide 2014 (opens in a new tab); Ide 2016 (opens in a new tab); Little 2015 (opens in a new tab); MacIntyre 2011 (opens in a new tab); MacIntyre 2015 (opens in a new tab); Nicholson 2014 (opens in a new tab); Priest 2014 (opens in a new tab); Radonovich 2019 (opens in a new tab); Ram 2015 (opens in a new tab); Savolainen‐Kopra 2012 (opens in a new tab); Stebbins 2011 (opens in a new tab); Suess 2012 (opens in a new tab); Turner 2012 (opens in a new tab)). Aiello 2012 (opens in a new tab) randomised all residence houses in each of the residence halls prior to the intervention implementation. Alzaher 2018 (opens in a new tab) allocated schools prior to all schoolgirls attending selected schools being invited to participate. Azor‐Martinez 2016 (opens in a new tab) allocated schools/classes prior to children's recruitment. Azor‐Martinez 2018 (opens in a new tab) assigned clusters prior to recruitment. Biswas 2019 (opens in a new tab) completed the allocation prior to individuals being recruited. Chard 2019 (opens in a new tab) allocated schools prior to individuals being recruited. Goodall 2014 (opens in a new tab) used opaque, sealed, serially numbered envelopes that were only accessed when two study personnel were present. Ide 2014 (opens in a new tab) also reported using individual drawing of sealed, opaque envelopes to randomly assign participants to the study groups. MacIntyre 2011 (opens in a new tab) randomised hospitals prior to inclusion of participants. In MacIntyre 2015 (opens in a new tab), hospital wards were randomised prior to recruitment of individuals. Nicholson 2014 (opens in a new tab) used coin tossing to assign communities to intervention or control arms. Radonovich 2019 (opens in a new tab) used constrained randomisation to resolve any potential imbalance between covariates between the trial arms. Four studies reported the use of central randomisation: Canini 2010 (opens in a new tab) used central randomisation by employing an interactive voice response system; Ide 2016 (opens in a new tab) used central randomisation services; Little 2015 (opens in a new tab) participants were automatically randomly assigned by the intervention software; and Ram 2015 (opens in a new tab) described a central allocation through data collectors notifying the field research officer, who consulted the block randomisation list to make the assignment of the household compound to intervention or control. Savolainen‐Kopra 2012 (opens in a new tab) randomised clusters by matching prior to the onset of the interventions. Four studies reported that allocation was assigned by personnel (investigator, physician, or statistician) unaware of the randomisation sequence (Priest 2014 (opens in a new tab); Stebbins 2011 (opens in a new tab); Suess 2012 (opens in a new tab); Turner 2012 (opens in a new tab)). Twenty‐two studies reported insufficient information to permit a judgement on the adequacy of the process to minimise selection bias (Aelami 2015 (opens in a new tab); Arbogast 2016 (opens in a new tab); Ban 2015 (opens in a new tab); Barasheed 2014 (opens in a new tab); Correa 2012 (opens in a new tab); DiVita 2011 (opens in a new tab); Feldman 2016 (opens in a new tab); Hartinger 2016 (opens in a new tab); Hubner 2010 (opens in a new tab); Huda 2012 (opens in a new tab); Ibfelt 2015 (opens in a new tab); MacIntyre 2013 (opens in a new tab); McConeghy 2017 (opens in a new tab); Millar 2016 (opens in a new tab); Miyaki 2011 (opens in a new tab); Najnin 2019 (opens in a new tab); Pandejpong 2012 (opens in a new tab); Simmerman 2011 (opens in a new tab); Talaat 2011 (opens in a new tab); Temime 2018 (opens in a new tab); Yeung 2011 (opens in a new tab); Zomer 2015 (opens in a new tab)). Two studies provided some information about allocation, but it was not enough to permit a judgement on the risk of bias (Barasheed 2014 (opens in a new tab); Simmerman 2011 (opens in a new tab)). Barasheed 2014 (opens in a new tab) randomised pilgrim tents using an independent study co‐ordinator who was not an investigator, but did not describe how this was done. Simmerman 2011 (opens in a new tab) described using a study co‐ordinator to assign households to the study arm (after consent was obtained). Only one of the newly added studies was judged as at high risk of bias, where the random assignment was allocated by doctors enrolling the participants (MacIntyre 2016 (opens in a new tab)). Of the previously included RCTs, 14 provided no or an insufficient description of concealment of allocation (Carabin 1999 (opens in a new tab); Farr 1988a (opens in a new tab); Farr 1988b (opens in a new tab); Gwaltney 1980 (opens in a new tab); Kotch 1994 (opens in a new tab); Ladegaard 1999 (opens in a new tab); Larson 2010 (opens in a new tab); MacIntyre 2009 (opens in a new tab); Morton 2004 (opens in a new tab); Roberts 2000 (opens in a new tab); Sandora 2008 (opens in a new tab); Turner 2004a (opens in a new tab); Turner 2004b (opens in a new tab); White 2001 (opens in a new tab)). We assessed all of the remaining studies as at low risk of bias (Canini 2010 (opens in a new tab); Cowling 2008 (opens in a new tab); Cowling 2009 (opens in a new tab); Loeb 2009 (opens in a new tab); Longini 1988 (opens in a new tab); LLuby 2005 (opens in a new tab); Sandora 2005 (opens in a new tab);Satomura 2005 (opens in a new tab)). Aiello 2010 (opens in a new tab) used the drawing of a uniform ticket with the name of each hall out of a container and was rated as at high risk of bias.
Blinding
Although blinding is less of a concern in cluster‐RCTs, the risk of bias is substantial when the outcomes are subjective and the outcome assessor is not blinded.
In this 2022 review, five RCTs (Almanza‐Reyes 2021 (opens in a new tab); Bundgaard 2021 (opens in a new tab); Fretheim 2022a (opens in a new tab); Gutiérrez‐García 2022 (opens in a new tab); Helsingen 2021 (opens in a new tab)), and six cluster‐RCTs were all judged to have a high risk of detection bias (Abaluck 2022 (opens in a new tab); Alfelali 2020 (opens in a new tab); Ashraf 2020 (opens in a new tab); Swarthout 2020 (opens in a new tab); Teesing 2021 (opens in a new tab); Young 2021 (opens in a new tab)).
We judged two of the newly included studies to have a low risk of detection bias as the outcome is laboratory‐confirmed (Alfelali 2020 (opens in a new tab); Gutiérrez‐García 2022 (opens in a new tab)). One study provided insufficient information to enable judgment (Almanza‐Reyes 2021 (opens in a new tab)). The remaining eight of the 11 new studies have a high risk of detection bias (Abaluck 2022 (opens in a new tab); Ashraf 2020 (opens in a new tab); Bundgaard 2021 (opens in a new tab); Fretheim 2022a (opens in a new tab); Helsingen 2021 (opens in a new tab); Swarthout 2020 (opens in a new tab); Teesing 2021 (opens in a new tab); Young 2021 (opens in a new tab)). In Abaluck 2022 (opens in a new tab), investigators dropped individuals for whom symptom data were missing. In addition, other outcomes were subjective and can be influenced by the unblinded mask promoters, and mask surveillance staff. Moreover, blood testing in the protocol specified baseline testing which was not done, and no further explanation was provided. In Ashraf 2020 (opens in a new tab), although the data collection team was separate from the intervention team, they were not blinded, and the outcome was respiratory illness measured through caregiver‐reported symptoms. In Bundgaard 2021 (opens in a new tab), case detection was based on patient‐reported symptoms on home tests. In Fretheim 2022a (opens in a new tab), the outcome was self‐reported positive COVID‐19 test result, notified to the Norwegian Surveillance System for Communicable Diseases (MSIS). However, the public policy requiring confirmatory PCR‐test had changed during the study, which may have affected reporting. In Helsingen 2021 (opens in a new tab), although the outcome was a positive test for COVID‐19 based on SARS‐CoV‐2 ribonucleic acid, the samples were collected and sent by participants, and there was a difference in adherence in testing between the two groups. Swarthout 2020 (opens in a new tab), Teesing 2021 (opens in a new tab), and Young 2021 (opens in a new tab) all had subjective outcomes and assessors were not blinded. As for the detection bias, six of the newly included studies were considered to have a high risk of detection bias (Bundgaard 2021 (opens in a new tab); Gutiérrez‐García 2022 (opens in a new tab); Helsingen 2021 (opens in a new tab); Swarthout 2020 (opens in a new tab); Teesing 2021 (opens in a new tab); Young 2021 (opens in a new tab). In Bundgaard 2021 (opens in a new tab), case detection was based on patient‐reported symptoms and results from home point‐of‐care (POCT) testing. The primary outcome of Gutiérrez‐García 2022 (opens in a new tab) was participants' self‐reported symptoms. Case detection in Helsingen 2021 (opens in a new tab) was based on a home‐test kit. Swarthout 2020 (opens in a new tab), Teesing 2021 (opens in a new tab), and Young 2021 (opens in a new tab) had subjective outcomes.
In the 2020 review, we judged 36 studies to have a high risk of bias (Aiello 2012 (opens in a new tab); Abaluck 2022 (opens in a new tab); Alfelali 2020 (opens in a new tab); Almanza‐Reyes 2021 (opens in a new tab); Alzaher 2018 (opens in a new tab); Arbogast 2016 (opens in a new tab); Ashraf 2020 (opens in a new tab); Azor‐Martinez 2016 (opens in a new tab); Azor‐Martinez 2018 (opens in a new tab); Ban 2015 (opens in a new tab); Biswas 2019 (opens in a new tab); Bundgaard 2021 (opens in a new tab); Carabin 1999 (opens in a new tab); Chard 2019 (opens in a new tab); Correa 2012 (opens in a new tab); Cowling 2008 (opens in a new tab); Gutiérrez‐García 2022 (opens in a new tab); Helsingen 2021 (opens in a new tab); Ide 2014 (opens in a new tab); Kotch 1994 (opens in a new tab); Ladegaard 1999 (opens in a new tab); Little 2015 (opens in a new tab); MacIntyre 2011 (opens in a new tab); MacIntyre 2015 (opens in a new tab); MacIntyre 2016 (opens in a new tab); McConeghy 2017 (opens in a new tab); Najnin 2019 (opens in a new tab); Nicholson 2014 (opens in a new tab); Ram 2015 (opens in a new tab); Sandora 2008 (opens in a new tab); Savolainen‐Kopra 2012 (opens in a new tab); Swarthout 2020 (opens in a new tab); Teesing 2021 (opens in a new tab); Temime 2018 (opens in a new tab); Young 2021 (opens in a new tab); Zomer 2015 (opens in a new tab)). We assessed five cluster‐RCTs as at low risk of bias. Farr 1988a (opens in a new tab) and Farr 1988b (opens in a new tab) were double‐blinded studies and were judged as at low risk of bias. MacIntyre 2013 (opens in a new tab) and Simmerman 2011 (opens in a new tab) reported laboratory‐confirmed influenza, and blinding would not have affected the result. In Miyaki 2011 (opens in a new tab) the self‐reported respiratory symptoms were confirmed by a physician.
We judged four cluster‐RCTs to have a low risk of detection bias because the outcome was laboratory‐confirmed influenza (Alfelali 2020 (opens in a new tab); Barasheed 2014 (opens in a new tab); Suess 2012 (opens in a new tab)), or physician‐confirmed ILI, Pandejpong 2012 (opens in a new tab). Another two cluster‐RCTs were judged to have a low risk of bias because outcome assessors were blinded (Abaluck 2022 (opens in a new tab); Ashraf 2020 (opens in a new tab)). One RCT (Almanza‐Reyes 2021 (opens in a new tab)) and two cluster‐RCTs (Talaat 2011 (opens in a new tab); Yeung 2011 (opens in a new tab)) provided insufficient data to judge the effect of non‐blinding. Talaat 2011 (opens in a new tab) included outcomes that were both self‐reported ILI and laboratory‐confirmed influenza. In Yeung 2011 (opens in a new tab) the detection of cases was based on records for hospitalisation related to infection (including pneumonia). Eleven cluster‐RCTs were not blinded, but we judged the primary outcome to be unaffected by non‐blinding. Seven trials reported laboratory‐confirmed influenza (Aiello 2012 (opens in a new tab); Cowling 2009 (opens in a new tab); Larson 2010 (opens in a new tab); Loeb 2009 (opens in a new tab); MacIntyre 2009 (opens in a new tab); Millar 2016 (opens in a new tab); Stebbins 2011 (opens in a new tab)). Four studies reported self‐reported outcomes (Canini 2010 (opens in a new tab); Priest 2014 (opens in a new tab); Roberts 2000 (opens in a new tab); Sandora 2008 (opens in a new tab)), but outcome assessors were not aware of the intervention assignment. Five RCTs were double‐blinded and were judged as at low risk of bias (Goodall 2014 (opens in a new tab); Ide 2016 (opens in a new tab); Longini 1988 (opens in a new tab); Luby 2005 (opens in a new tab); White 2001 (opens in a new tab)), whilst two studies were single‐blinded where investigators, Radonovich 2019 (opens in a new tab), or laboratory personnel, Turner 2012 (opens in a new tab), were blinded. Four RCTs were not blinded and were judged as at high risk of bias given the subjective nature of the outcome assessed (Hubner 2010 (opens in a new tab); Ibfelt 2015 (opens in a new tab); Jacobs 2009 (opens in a new tab); Satomura 2005 (opens in a new tab)). Turner 2004a (opens in a new tab) and Turner 2004b (opens in a new tab) were double‐blind studies, but insufficient information was provided to assess the risk of bias.
Incomplete outcome data
In this 2022 review, six of the 11 newly included studies had reasonable attrition and provided sufficient evidence about participant flow throughout the study and reasons of loss to follow‐up, and hence were assessed as having a low risk of attrition bias (Alfelali 2020 (opens in a new tab); Ashraf 2020 (opens in a new tab); Bundgaard 2021 (opens in a new tab); Fretheim 2022a (opens in a new tab); Gutiérrez‐García 2022 (opens in a new tab); Swarthout 2020 (opens in a new tab)). Two studies provided insufficient information to assess the attrition risk (Almanza‐Reyes 2021 (opens in a new tab); Teesing 2021 (opens in a new tab)). The remaining three studies were judged at high risk of attrition bias. In Abaluck 2022 (opens in a new tab), laboratory testing results were only available for 40% of the symptomatic participants. In Helsingen 2021 (opens in a new tab), more people in the control group withdrew from the study and reasons for withdrawal were not provided. In the Young 2021 (opens in a new tab) study there was high attrition at different rates between the two groups.
In the 2020 review, we assessed 26 newly included trials as having a low risk of attrition bias, with sufficient evidence from the participant flow chart, and explanation of loss to follow‐up (which was minimal) similar between groups (Aiello 2012 (opens in a new tab); Alzaher 2018 (opens in a new tab); Arbogast 2016 (opens in a new tab); Azor‐Martinez 2018 (opens in a new tab); Barasheed 2014 (opens in a new tab); Canini 2010 (opens in a new tab); Chard 2019 (opens in a new tab); Correa 2012 (opens in a new tab); Goodall 2014 (opens in a new tab); Hartinger 2016 (opens in a new tab); Hubner 2010 (opens in a new tab); Ide 2014 (opens in a new tab); Ide 2016 (opens in a new tab); MacIntyre 2011 (opens in a new tab); MacIntyre 2013 (opens in a new tab); MacIntyre 2015 (opens in a new tab); MacIntyre 2016 (opens in a new tab); Miyaki 2011 (opens in a new tab); Pandejpong 2012 (opens in a new tab); Radonovich 2019 (opens in a new tab); Ram 2015 (opens in a new tab); Simmerman 2011 (opens in a new tab); Suess 2012 (opens in a new tab); Turner 2012 (opens in a new tab); Yeung 2011 (opens in a new tab); Zomer 2015 (opens in a new tab)). Seven studies did not report sufficient information on incomplete data (attrition bias) (Aelami 2015 (opens in a new tab); DiVita 2011 (opens in a new tab); Feldman 2016 (opens in a new tab); Hartinger 2016 (opens in a new tab); Ibfelt 2015 (opens in a new tab); McConeghy 2017 (opens in a new tab); Priest 2014 (opens in a new tab)). Twelve studies had a high risk of attrition bias (Azor‐Martinez 2016 (opens in a new tab); Ban 2015 (opens in a new tab); Biswas 2019 (opens in a new tab); Huda 2012 (opens in a new tab); Little 2015 (opens in a new tab); Millar 2016 (opens in a new tab); Najnin 2019 (opens in a new tab); Nicholson 2014 (opens in a new tab); Savolainen‐Kopra 2012 (opens in a new tab); Stebbins 2011 (opens in a new tab); Talaat 2011 (opens in a new tab); Temime 2018 (opens in a new tab)). In Azor‐Martinez 2016 (opens in a new tab), attrition levels were high and differed between the two groups. Ban 2015 (opens in a new tab) did not report on reasons for loss to follow‐up. Biswas 2019 (opens in a new tab) did not provide information on missing participants (28 children in the control schools and two children in the intervention schools). Huda 2012 (opens in a new tab) did not provide a flow diagram of study participants. Little 2015 (opens in a new tab) had high attrition that differed between the two groups. Attrition in Millar 2016 (opens in a new tab) differed amongst the three groups. In addition, ARI cases were captured utilising clinic‐based medical records for those participants who sought hospital care only. In Najnin 2019 (opens in a new tab), there was high migration movement during the study, which could have distorted the baseline characteristics even more. There was no description of how such migration and changes in the intervention group were dealt with. In Nicholson 2014 (opens in a new tab), households were removed from the study if they provided no data for five consecutive weeks. Although attrition was reported in Savolainen‐Kopra 2012 (opens in a new tab), and 76% of volunteers who were recruited at the beginning of the reporting period completed the study, new recruits were added during the study to replace volunteers lost in most clusters. The total number of reporting participants at the end of the trial was 626 (91.7%) compared to the beginning, meaning that 15.7% of participants were replaced during the study. In Stebbins 2011 (opens in a new tab),reasons for episodes of absence in 66% of the study participants were not reported. Talaat 2011 (opens in a new tab) did not provide a flow chart of clusters flow during the study period and provided no information on withdrawal. Temime 2018 (opens in a new tab) was greatly biased due to underreporting of outcomes in the control groups. Furthermore, no study flow chart was provided, and there was no reporting on any exclusions.
Selective reporting
For this 2022 review update, six of the 11 newly included studies reported all specified outcomes and were judged to have a low risk of selective reporting (Ashraf 2020 (opens in a new tab); Bundgaard 2021 (opens in a new tab); Fretheim 2022a (opens in a new tab); Gutiérrez‐García 2022 (opens in a new tab); Helsingen 2021 (opens in a new tab); Young 2021 (opens in a new tab)). Three studies had no published protocol and were considered to have an unclear risk of selective reporting (Alfelali 2020 (opens in a new tab); Almanza‐Reyes 2021 (opens in a new tab); Teesing 2021 (opens in a new tab)). The remaining two new included studies are considered to have a high risk of bias in this domain. Abaluck 2022 (opens in a new tab) did not report on prespecified seroconversion, while in Swarthout 2020 (opens in a new tab), none of the outcomes reported were prespecified in the trial registry.
In the 2020 review, 22 included studies reported all specified outcomes and were judged as at low risk of reporting bias (Aiello 2012 (opens in a new tab); Barasheed 2014 (opens in a new tab); Canini 2010 (opens in a new tab); Chard 2019 (opens in a new tab); Goodall 2014 (opens in a new tab); Hartinger 2016 (opens in a new tab); Ibfelt 2015 (opens in a new tab); Ide 2016 (opens in a new tab); Little 2015 (opens in a new tab); MacIntyre 2011 (opens in a new tab); MacIntyre 2013 (opens in a new tab); MacIntyre 2015 (opens in a new tab); MacIntyre 2016 (opens in a new tab); Pandejpong 2012 (opens in a new tab); Priest 2014 (opens in a new tab); Radonovich 2019 (opens in a new tab); Savolainen‐Kopra 2012 (opens in a new tab); Simmerman 2011 (opens in a new tab); Suess 2012 (opens in a new tab); Temime 2018 (opens in a new tab); Turner 2012 (opens in a new tab); Zomer 2015 (opens in a new tab)). For 18 studies, it is unlikely that other outcomes were measured and not reported, although no protocol was available to assess reporting bias (Aelami 2015 (opens in a new tab); Alzaher 2018 (opens in a new tab); Arbogast 2016 (opens in a new tab); Azor‐Martinez 2016 (opens in a new tab); Azor‐Martinez 2018 (opens in a new tab); Ban 2015 (opens in a new tab); Biswas 2019 (opens in a new tab); Correa 2012 (opens in a new tab); DiVita 2011 (opens in a new tab); Feldman 2016 (opens in a new tab); Hubner 2010 (opens in a new tab); Huda 2012 (opens in a new tab); Ide 2014 (opens in a new tab); Miyaki 2011 (opens in a new tab); Nicholson 2014 (opens in a new tab); Stebbins 2011 (opens in a new tab); Talaat 2011 (opens in a new tab); Yeung 2011 (opens in a new tab)). Three studies were at high risk of reporting bias (McConeghy 2017 (opens in a new tab); Millar 2016 (opens in a new tab); Najnin 2019 (opens in a new tab)). In McConeghy 2017 (opens in a new tab), URTI was mentioned in the methods (the intervention presumably would have targeted these), but only lower respiratory tract infection (LRTI) and overall infection were reported. Millar 2016 (opens in a new tab) was originally conducted for another purpose; we could not find the respiratory outcomes reported in the study as part of the original study protocol. In Najnin 2019 (opens in a new tab), the published study protocol did not include respiratory illness as an outcome.
Other potential sources of bias
An additional consideration for cluster‐RCTs is identification/recruitment bias, where individuals are recruited in the trial after clusters are randomised. Such bias can introduce an imbalance amongst groups.
In this 2022 review, of the six cluster‐RCTs included, we judged four to have a low risk of identification/recruitment bias (Abaluck 2022 (opens in a new tab); Ashraf 2020 (opens in a new tab); Swarthout 2020 (opens in a new tab); Teesing 2021 (opens in a new tab)). In Abaluck 2022 (opens in a new tab), all of people in the village were assigned to one study arm (control, cloth mask or surgical mask villages). In Ashraf 2020 (opens in a new tab), participants were unaware of their intervention group assignment until after the baseline survey and randomisation. In Swarthout 2020 (opens in a new tab), village clusters comprised of 12 enrolled households, while in Teesing 2021 (opens in a new tab) randomisation was done per nursing home. Alfelali 2020 (opens in a new tab) recruited individuals after cluster‐randomisation and is judged to have a high risk of recruitment bias, while in Young 2021 (opens in a new tab), participation of students and staff contacts were made after random assignment of the school through written consent or electronic completion of a consent form.
Of the cluster‐RCTs included in our 2020 review, we judged 13 to have a low risk of identification/recruitment bias (Arbogast 2016 (opens in a new tab); Biswas 2019 (opens in a new tab); Canini 2010 (opens in a new tab); Cowling 2008 (opens in a new tab); Longini 1988 (opens in a new tab); Luby 2005 (opens in a new tab); MacIntyre 2015 (opens in a new tab); MacIntyre 2016 (opens in a new tab); Roberts 2000 (opens in a new tab); Sandora 2005 (opens in a new tab); Suess 2012 (opens in a new tab); Temime 2018 (opens in a new tab); White 2001 (opens in a new tab)). In Arbogast 2016 (opens in a new tab), all identified individuals (office workers) were included in the assigned cluster. Schools were identified and then randomised to the clusters; students were then randomly selected from each classroom and school. Nine studies described the identification of participants, consenting/enrolling, and then randomising to the clusters (Canini 2010 (opens in a new tab); Cowling 2008 (opens in a new tab); Longini 1988 (opens in a new tab); Luby 2005 (opens in a new tab); MacIntyre 2015 (opens in a new tab); MacIntyre 2016 (opens in a new tab); Roberts 2000 (opens in a new tab); Sandora 2005 (opens in a new tab); White 2001 (opens in a new tab)). Suess 2012 (opens in a new tab) identified and consented patients, then recruitment was performed by physicians unaware of cluster assignment. In Temime 2018 (opens in a new tab), directors of the included nursing homes agreed to participate in the study before randomisation, and written consent was not required from the residents.
Amongst the newly included studies, we judged four cluster‐RCTs as at low risk of identification/recruitment bias (Abaluck 2022 (opens in a new tab); Swarthout 2020 (opens in a new tab); Teesing 2021 (opens in a new tab); Young 2021 (opens in a new tab)). In Abaluck 2022 (opens in a new tab), the village was the unit of randomisation and all households received one arm of the study (control, surgical mask or cloth mask). In Swarthout 2020 (opens in a new tab), village clusters were each randomised by blocks (group of nine adjacent clusters) into eight groups. In Teesing 2021 (opens in a new tab) nursing homes were computer randomised after baseline hand hygiene measurements to either the intervention arm or the control arm. In Young 2021 (opens in a new tab), schools were randomly assigned (1:1) to either a policy of offering contacts daily testing over seven days to allow continued school attendance (intervention group) or to follow the usual policy of isolation of contacts for 10 days (control group). In two studies there were insufficient details to permit a judgement of the risk of bias (Alfelali 2020 (opens in a new tab); Ashraf 2020 (opens in a new tab)).
In the 2020 review, we judged 11 cluster‐RCTs as at high risk of identification/recruitment bias (Aiello 2010 (opens in a new tab); Aiello 2012 (opens in a new tab); Azor‐Martinez 2018 (opens in a new tab); Chard 2019 (opens in a new tab); Correa 2012 (opens in a new tab); Cowling 2009 (opens in a new tab); Larson 2010 (opens in a new tab); McConeghy 2017 (opens in a new tab); Nicholson 2014 (opens in a new tab); Priest 2014 (opens in a new tab); Savolainen‐Kopra 2012 (opens in a new tab)). In Aiello 2010 (opens in a new tab) and Aiello 2012 (opens in a new tab), recruitment continued for two weeks after the start of the study, which could have introduced bias. Six trials identified and recruited participants after cluster randomisation (Azor‐Martinez 2018 (opens in a new tab); Chard 2019 (opens in a new tab); Cowling 2009 (opens in a new tab); Larson 2010 (opens in a new tab); McConeghy 2017 (opens in a new tab); Nicholson 2014 (opens in a new tab)). Three trials recruited new participants after the start of the study to replace those lost to follow‐up (Correa 2012 (opens in a new tab); Priest 2014 (opens in a new tab); Savolainen‐Kopra 2012 (opens in a new tab)). We judged five cluster‐RCTs to have probable identification/recruitment bias (Alzaher 2018 (opens in a new tab); Barasheed 2014 (opens in a new tab); MacIntyre 2011 (opens in a new tab); Najnin 2019 (opens in a new tab); Radonovich 2019 (opens in a new tab)), whereas in 19 studies there were insufficient details to permit a judgement of risk of bias (Carabin 1999 (opens in a new tab); DiVita 2011 (opens in a new tab); Feldman 2016 (opens in a new tab); Hartinger 2016 (opens in a new tab); Huda 2012 (opens in a new tab); Ibfelt 2015 (opens in a new tab); Kotch 1994 (opens in a new tab); Ladegaard 1999 (opens in a new tab); MacIntyre 2009 (opens in a new tab); MacIntyre 2013 (opens in a new tab); Millar 2016 (opens in a new tab); Miyaki 2011 (opens in a new tab); Pandejpong 2012 (opens in a new tab); Radonovich 2019 (opens in a new tab); Sandora 2008 (opens in a new tab); Stebbins 2011 (opens in a new tab); Talaat 2011 (opens in a new tab); Yeung 2011 (opens in a new tab); Zomer 2015 (opens in a new tab)).
Two of the newly included cluster‐RCTs reported intracluster correlation coefficient (ICC) to adjust sample size, taking into consideration clustering effects, and described adjusting outcomes for clustering effect using different statistical methods, or provided justification for not performing adjusted analysis for clustering (Alfelali 2020 (opens in a new tab); Swarthout 2020 (opens in a new tab)). For four studies there were insufficient details to permit a judgement of risk of bias (Abaluck 2022 (opens in a new tab); Ashraf 2020 (opens in a new tab); Teesing 2021 (opens in a new tab); Young 2021 (opens in a new tab)) since they provided insufficient details on ICC and/or did not perform adjusted analysis or justified the absence of it.
Twenty‐six cluster‐RCTs identified in the 2020 review reported intracluster correlation coefficient (ICC) to adjust sample size, taking into consideration clustering effects, and described adjusting outcomes for clustering effect using different statistical methods, or provided justification for not performing adjusted analysis for clustering (Aiello 2010 (opens in a new tab); Aiello 2012 (opens in a new tab); Arbogast 2016 (opens in a new tab); Canini 2010 (opens in a new tab); Carabin 1999 (opens in a new tab); Correa 2012 (opens in a new tab); Cowling 2008 (opens in a new tab); Cowling 2009 (opens in a new tab); Hartinger 2016 (opens in a new tab); Huda 2012 (opens in a new tab); Little 2015 (opens in a new tab); Luby 2005 (opens in a new tab); MacIntyre 2009 (opens in a new tab); MacIntyre 2011 (opens in a new tab); MacIntyre 2013 (opens in a new tab); MacIntyre 2015 (opens in a new tab); MacIntyre 2016 (opens in a new tab); McConeghy 2017 (opens in a new tab); Priest 2014 (opens in a new tab); Radonovich 2019 (opens in a new tab); Ram 2015 (opens in a new tab); Roberts 2000 (opens in a new tab); Stebbins 2011 (opens in a new tab); Suess 2012 (opens in a new tab); Talaat 2011 (opens in a new tab); Temime 2018 (opens in a new tab)). Five cluster‐RCTs did not report the ICC but described adjusting outcomes for clustering effect using different statistical methods, or explained why adjusted analysis for clustering was not performed (Biswas 2019 (opens in a new tab); Chard 2019 (opens in a new tab); McConeghy 2017 (opens in a new tab); Simmerman 2011 (opens in a new tab); Zomer 2015 (opens in a new tab)). Thirteen cluster‐RCTs provided insufficient details on ICC and/or did not perform adjusted analysis or justified the absence of it (Alzaher 2018 (opens in a new tab); Azor‐Martinez 2016 (opens in a new tab); Azor‐Martinez 2018 (opens in a new tab); Barasheed 2014 (opens in a new tab); Feldman 2016 (opens in a new tab); Larson 2010 (opens in a new tab); Millar 2016 (opens in a new tab); Miyaki 2011 (opens in a new tab); Najnin 2019 (opens in a new tab); Nicholson 2014 (opens in a new tab); Pandejpong 2012 (opens in a new tab); Savolainen‐Kopra 2012 (opens in a new tab); Yeung 2011 (opens in a new tab)). Two cluster‐RCTs reported the ICC but did not perform adjusted analysis or justified the absence of it (Sandora 2005 (opens in a new tab); Sandora 2008 (opens in a new tab)).
Effects of interventions
See: Summary of findings 1 (opens in a new tab) Medical/surgical masks compared to no masks for preventing the spread of viral respiratory illness (opens in a new tab); Summary of findings 2 (opens in a new tab) N95 respirators compared to medical/surgical masks for preventing the spread of viral respiratory illness (opens in a new tab); Summary of findings 3 (opens in a new tab) Hand hygiene compared to control for preventing the spread of viral respiratory illness (opens in a new tab)
Comparison 1: Medical/surgical masks compared to no masks
We included 12 trials (10 of which were cluster‐RCTs) comparing medical/surgical masks versus no masks (Abaluck 2022 (opens in a new tab); Alfelali 2020 (opens in a new tab); Aiello 2012 (opens in a new tab); Barasheed 2014 (opens in a new tab); Bundgaard 2021 (opens in a new tab); Canini 2010 (opens in a new tab); Cowling 2008 (opens in a new tab); Jacobs 2009 (opens in a new tab); MacIntyre 2009 (opens in a new tab); MacIntyre 2015 (opens in a new tab); MacIntyre 2016 (opens in a new tab); Suess 2012 (opens in a new tab)). Two trials were conducted with healthcare workers (HCWs) (Jacobs 2009 (opens in a new tab); MacIntyre 2015 (opens in a new tab)), whilst the other 10 studies included people living in the community. In the acute care hospital setting, as opposed to the community setting, variable mask use occurred, according to usual practices in the settings where the studies were undertaken, varying from just under 16% most of the time to 23.6% wearing for > 70% of all working hours (Jacobs 2009 (opens in a new tab); MacIntyre 2015 (opens in a new tab)). We therefore excluded the two studies in the acute care hospital setting from the meta‐analysis, and report results from these studies narratively. Ten trials were conducted in non‐pandemic settings, and two were conducted during the SARS‐CoV‐2 pandemic (Abaluck 2022 (opens in a new tab); Bundgaard 2021 (opens in a new tab)).
Primary outcomes
- Numbers of cases of viral respiratory illness
Influenza/COVID‐like illness
Pooling of nine trials conducted in the community found an estimate of effect for the outcomes of influenza/COVID‐like illness cases (risk ratio (RR) 0.95, 95% confidence interval (CI) 0.84 to 1.09; 9 trials; 276,917 participants; moderate‐certainty evidence; Analysis 1.1 (opens in a new tab)) suggesting that wearing a medical/surgical mask will probably make little or no difference for this outcome. Two studies in healthcare workers provided inconclusive results with very wide confidence intervals: RR 0.88, 95% CI 0.02 to 32; and RR 0.26, 95% CI 0.03 to 2.51, respectively (Jacobs 2009 (opens in a new tab); MacIntyre 2015 (opens in a new tab)).
Laboratory‐confirmed influenza/SARS‐CoV‐2 cases
Similarly, the estimate of effect for laboratory‐confirmed influenza/SARS‐CoV‐2 cases (RR 1.01, 95% CI 0.72 to 1.42; 6 trials, 13,919 participants; moderate‐certainty evidence; Analysis 1.1 (opens in a new tab)) suggests that wearing a medical/surgical mask probably makes little or no difference compared to not wearing a mask for this outcome.
Laboratory‐confirmed other respiratory viruses
One community study reported on laboratory‐confirmed other respiratory viruses, showing RR 0.58, 95% CI 0.25 to 1.31; Analysis 1.1 (opens in a new tab), and another study in healthcare workers reported RR 0.79, 95% CI 0.42 to 1.52 (MacIntyre 2015 (opens in a new tab)).
Assessing both source control and personal protection
The design of most trials assessed whether masks protected the wearer. Six trials were cluster‐RCTs, with all participants in the intervention clusters required to wear masks, thus assessing both source control and personal protection. In two trials the clusters were households with a member with new influenza; neither of these studies found any protective effect (RR 1.03 in 105 households (Canini 2010 (opens in a new tab)); RR 1.21 in 145 households (MacIntyre 2009 (opens in a new tab))). In two trials the clusters were college dormitories during the influenza season; neither study found any reduction (RR 1.10 in 37 dormitories (Aiello 2012 (opens in a new tab)); RR 0.90 in three dormitories (Aiello 2010 (opens in a new tab))).
Studies conducted during the SARS‐CoV‐2 pandemic
Two studies were conducted during the SARS‐CoV‐2 pandemic (Abaluck 2022 (opens in a new tab); Bundgaard 2021 (opens in a new tab)), with the former being a very large cluster‐RCT of villages in Bangledesh and the latter a large RCT conducted in Denmark.
Exclusion of study due to insufficient number of clusters
We excluded Aiello 2010 (opens in a new tab) from the meta‐analysis since we did not consider 'randomisation' of three clusters to three arms to be a proper randomised trial.
- Adverse events related to the intervention
Canini 2010 (opens in a new tab) reported that 38 (75%) of participants in the intervention arm experienced discomfort with the mask use due to warmth (45%), respiratory difficulties (33%), and humidity (33%). Children reported feeling pain more frequently (3/12) than other participants wearing adult face masks (1/39; P = 0.04). In MacIntyre 2015 (opens in a new tab), adverse events associated with face mask use were reported in 40.4% (227/562) of HCWs in the medical‐mask arm. General discomfort (35.1%; 397/1130) and breathing problems (18.3%; 207/1130) were the most frequently reported adverse events. Suess 2012 (opens in a new tab) reported that the majority of participants (107/172; 62%) did not report any problems with mask‐wearing. More adults reported no problems (71%) compared to children (36/72; 50%; P = 0.005). The main issues when wearing a face mask for adults as well as for children were "heat/humidity" (18/34; 53% of children; 10/29; 35% of adults; P = 0.1), followed by "pain" and "shortness of breath". Alfelali 2020 (opens in a new tab) reported the most common side effects of wearing a mask in Hajj pilgrims were difficulty in breathing (26%) and discomfort (22%). Although no details were provided, Bundgaard 2021 (opens in a new tab) mentioned that 14% of participants had adverse reactions. Cowling 2008 (opens in a new tab) and Abaluck 2022 (opens in a new tab) mentioned that no adverse events were reported. The other trials did not report measuring adverse outcomes.
Secondary outcomes
- Deaths
Not reported.
- Severity of viral respiratory illness as reported in the studies
Jacobs 2009 (opens in a new tab) reported that participants in the mask group were significantly more likely to experience more days with headache and feeling bad. They found no significant differences between the two groups for symptom severity scores. None of the other trials reported this outcome.
- Absenteeism
Not reported.
- Hospital admissions
Not reported.
- Complications related to the illness (e.g. pneumonia)
Not reported.
Comparison 2: N95/P2 respirators compared to medical/surgical masks
We included five trials comparing medical/surgical masks with N95/P2 respirators (Loeb 2009 (opens in a new tab); MacIntyre 2009 (opens in a new tab); MacIntyre 2011 (opens in a new tab); MacIntyre 2013 (opens in a new tab); Radonovich 2019 (opens in a new tab)). All of these trials except MacIntyre 2009 (opens in a new tab) included HCWs. MacIntyre 2009 (opens in a new tab) included carers and household members of children with a respiratory illness recruited from a paediatric outpatient department and a paediatric primary care practice in Sydney, Australia. None of the trials were conducted during the SARS‐CoV‐2 pandemic.
Primary outcomes
- Numbers of cases of viral respiratory illness
Clinical respiratory illness
Pooling of three trials found an estimate of effect suggesting considerable uncertainty as to whether an N95/P2 respirator provides any benefit compared to medical/surgical masks for the outcome of clinical respiratory illness (RR 0.70, 95% CI 0.45 to 1.10; 7799 participants, very low‐certainty evidence; Analysis 2.1 (opens in a new tab)) (MacIntyre 2011 (opens in a new tab); MacIntyre 2013 (opens in a new tab) (two arms); Radonovich 2019 (opens in a new tab)).
Influenza‐like‐illness
Based on five trials conducted in four healthcare settings and one household, the estimates of effect for the outcome of ILI (RR 0.82, 95% CI 0.66 to 1.03; 8407 participants, low‐certainty evidence; Analysis 2.1 (opens in a new tab)) suggest that N95/P2 respirators may make little or no difference for this outcome (Loeb 2009 (opens in a new tab); MacIntyre 2009 (opens in a new tab); MacIntyre 2011 (opens in a new tab); MacIntyre 2013 (opens in a new tab); Radonovich 2019 (opens in a new tab)).
Laboratory‐confirmed influenza
The estimate of the effect for the outcome of laboratory‐confirmed influenza infection (RR 1.10, 95% CI 0.90 to 1.34; 8407 participants, moderate‐certainty evidence; Analysis 2.1 (opens in a new tab)) suggests that the use of a N95/P2 respirator compared to a medical/surgical mask probably makes little or no difference for this more precise and objective outcome.
The outcomes clinical respiratory illness and ILI were reported separately. Considering how these outcomes were defined, it is highly likely that there was considerable overlap between the two, therefore these outcomes were not combined into a single clinical outcome (Analysis 2.1 (opens in a new tab)). The laboratory‐confirmed viral respiratory infection outcome included influenza primarily but multiple other common viral respiratory pathogens were also included in several studies. The laboratory‐confirmed viral infection outcome was considered more precise and objective in comparison to the clinical outcomes, which were more subjective and considered to be less precise. The findings did not change when we restricted the evidence to HCWs (Analysis 2.2 (opens in a new tab)).
- Adverse events related to the intervention
Harms were poorly reported, but generally discomfort wearing medical/surgical masks and N95/P32 respirators was mentioned in several studies. Radonovich 2019 (opens in a new tab) mentioned that participants wearing the N95 respirator reported skin irritation and worsening of acne. MacIntyre 2011 (opens in a new tab) reported that adverse events were more common with N95 respirators; in particular, discomfort was reported in 41.9% of N95 wearers versus 9.8% of medical‐mask wearers (P < 0.01); headaches were more common with N95 (13.4% versus 3.9%; P < 0.01); difficulty breathing was reported more often in the N95 group (19.4% versus 12.5%; P = 0.01); and N95 caused more problems with pressure on the nose (52.2% versus 11.0%; P < 0.01). In MacIntyre 2013 (opens in a new tab), fewer participants using the N95 respirator reported problems (38% (195/512) versus 48% (274/571) of participants in the medical‐mask arm; P = 0.001). Loeb 2009 (opens in a new tab) mentioned that no adverse events were reported.
The one trial conducted in the community mentioned that more than 50% of participants reported concerns with both types of masks, mainly that wearing them was uncomfortable, but there were no significant differences between the P2 (N95) and surgical‐mask groups (MacIntyre 2009 (opens in a new tab)).
Secondary outcomes
- Deaths
Not reported.
- Severity of viral respiratory illness as reported in the studies
Not reported.
- Absenteeism
Loeb 2009 (opens in a new tab) reported that 42 participants (19.8%) in the surgical‐mask group reported an episode of work‐related absenteeism compared with 39 (18.6%) of participants in the N95 respiratory group (absolute risk difference −1.24%, 95% CI −8.75% to 6.27%; P = 0.75).
- Hospital admissions
Not reported.
- Complications related to the illness (e.g. pneumonia)
Loeb 2009 (opens in a new tab) reported that there were no episodes of LRTIs.
Comparison 3: Hand hygiene compared to control
Nineteen trials compared hand hygiene interventions with control and provided sufficient data to include in meta‐analyses (Ashraf 2020 (opens in a new tab); Azor‐Martinez 2018 (opens in a new tab); Biswas 2019 (opens in a new tab); Correa 2012 (opens in a new tab); Cowling 2008 (opens in a new tab); Cowling 2009 (opens in a new tab); Hubner 2010 (opens in a new tab); Larson 2010 (opens in a new tab); Little 2015 (opens in a new tab); Millar 2016 (opens in a new tab); Nicholson 2014 (opens in a new tab); Ram 2015 (opens in a new tab); Roberts 2000 (opens in a new tab); Sandora 2005 (opens in a new tab); Simmerman 2011 (opens in a new tab); Stebbins 2011 (opens in a new tab); Swarthout 2020 (opens in a new tab); Teesing 2021 (opens in a new tab); Zomer 2015 (opens in a new tab)). The populations of these studies included adults, children, and families, in settings such as schools, childcare centres, homes, and offices. None of the studies was conducted during a pandemic, although a few studies were conducted during peak influenza seasons. A further 16 trials comparing hand hygiene to a control had other outcomes or insufficient information to include in meta‐analyses (Alzaher 2018 (opens in a new tab); Arbogast 2016 (opens in a new tab); Azor‐Martinez 2016 (opens in a new tab); DiVita 2011 (opens in a new tab); Feldman 2016 (opens in a new tab); Gwaltney 1980 (opens in a new tab); Ladegaard 1999 (opens in a new tab); Luby 2005 (opens in a new tab); Morton 2004 (opens in a new tab); Priest 2014 (opens in a new tab); Savolainen‐Kopra 2012 (opens in a new tab); Talaat 2011 (opens in a new tab); Temime 2018 (opens in a new tab); Turner 2012 (opens in a new tab); White 2001 (opens in a new tab); Yeung 2011 (opens in a new tab)). The results of these trials were consistent with the findings of our meta‐analyses. The results for all outcomes from the 19 trials that were meta‐analysed and the 16 trials that were not meta‐analysed are shown in Table 2 (opens in a new tab).
Open in table viewer (opens in a new tab)
Table 2. Results from trials of hand hygiene compared to control
ARI: acute respiratory infection
CI: confidence interval
cluster‐RCT: cluster‐randomised controlled trial
DB‐RCT: double‐blind randomised controlled trial
HH: hand hygiene
HS: hand sanitiser
HW: hand‐washing
ILI: influenza‐like illness
IRR: incidence rate ratio
NS: non‐significant
OR: odds ratio
RCT: randomised controlled trial
RR: risk ratio
RT‐PCR: reverse‐transcriptase polymerase chain reaction
SAR: secondary attack rate
URI: upper respiratory infection
yrs: years
Primary outcomes
- Numbers of cases of viral respiratory illness
Acute respiratory infection (ARI)
Pooling of nine trials for the broad outcome of ARI showed a 14% relative reduction in the numbers of participants with ARI (RR 0.86, 95% CI 0.81 to 0.90; 52,105 participants, moderate‐certainty evidence; Analysis 3.1.1) in the hand hygiene group (Analysis 3.1 (opens in a new tab)), suggesting a probable benefit (Ashraf 2020 (opens in a new tab); Azor‐Martinez 2018 (opens in a new tab); Correa 2012 (opens in a new tab); Larson 2010 (opens in a new tab); Little 2015 (opens in a new tab); Millar 2016 (opens in a new tab); Nicholson 2014 (opens in a new tab); Sandora 2005 (opens in a new tab); Swarthout 2020 (opens in a new tab)).
Influenza‐like‐illness (ILI) and laboratory‐confirmed influenza
When considering the more strictly defined outcomes of ILI (Biswas 2019 (opens in a new tab); Cowling 2008 (opens in a new tab); Cowling 2009 (opens in a new tab); Hubner 2010 (opens in a new tab); Larson 2010 (opens in a new tab); Little 2015 (opens in a new tab); Ram 2015 (opens in a new tab); Roberts 2000 (opens in a new tab); Simmerman 2011 (opens in a new tab); Teesing 2021 (opens in a new tab); Zomer 2015 (opens in a new tab)), and laboratory‐confirmed influenza (Biswas 2019 (opens in a new tab); Cowling 2008 (opens in a new tab); Cowling 2009 (opens in a new tab); Hubner 2010 (opens in a new tab); Larson 2010 (opens in a new tab); Ram 2015 (opens in a new tab); Simmerman 2011 (opens in a new tab); Stebbins 2011 (opens in a new tab)) the estimates of the effect were heterogeneous, suggesting that hand hygiene may make little or no difference (RR 0.94, 95% CI 0.81 to 1.09 for ILI; 34,503 participants, low‐certainty evidence; Analysis 3.1.2); (RR 0.91, 95% CI 0.63 to 1.30 for laboratory‐confirmed influenza; 8332 participants; low‐certainty evidence; Analysis 3.1 (opens in a new tab).3).
Composite outcome ‘ARI or ILI or influenza'
All 19 trials could be pooled for analysis of the composite outcome ‘ARI or ILI or influenza’, with each study only contributing once with the most comprehensive outcome (in terms of number of events) reported showing an 11% relative reduction in participants with a respiratory illness, suggesting that hand hygiene may offer a benefit (RR 0.89, 95% CI 0.83 to 0.94; low‐certainty evidence; Analysis 3.2 (opens in a new tab)), but with high heterogeneity. A funnel plot of the 19 trial results did not appear to suggest any small study effects for this outcome (Figure 4 (opens in a new tab)).

Sensitivity analysis
In a sensitivity analysis we used only the most precise and unequivocal (with laboratory confirmed considered the most precise and an undefined ARI considered the least precise) outcome reported in each of 12 studies identified by JMC, an infectious disease physician, and found an estimate of effect in favour of hand hygiene, but with wider CIs (RR 0.88, 95% CI 0.77 to 1.02; Analysis 3.3 (opens in a new tab)).
Subgroup analysis by age group
We considered that studies in children might have a different effect than studies in adults, so we conducted subgroup analysis by age group. We found no evidence of a difference in treatment effect by age group (P = 0.18; Analysis 3.4 (opens in a new tab)).
- Adverse events related to the intervention
Correa 2012 (opens in a new tab) reported that no adverse events were observed; in the study by Priest 2014 (opens in a new tab), skin reaction was recorded for 10.4% of participants in the hand sanitiser group versus 10.3% in the control group (RR 1.01, 95% CI 0.78 to 1.30).
Secondary outcomes
- Deaths
Not reported.
- Severity of viral respiratory illness as reported in the studies
Not reported.
- Absenteeism
Three trials measured absenteeism from school or work and demonstrated a 36% relative reduction in the numbers of participants with absence in the hand hygiene group (RR 0.64, 95% CI 0.58 to 0.71; Analysis 3.5 (opens in a new tab)) (Azor‐Martinez 2016 (opens in a new tab); Hubner 2010 (opens in a new tab); Nicholson 2014 (opens in a new tab)).
- Hospital admissions
Not reported.
- Complications related to the illness (e.g. pneumonia)
Not reported.
Comparison 4: Hand hygiene + medical/surgical masks compared to control
Primary outcomes
- Numbers of cases of viral respiratory illness (including ARIs, ILI, and laboratory‐confirmed influenza)
Six trials (Aelami 2015 (opens in a new tab); Aiello 2012 (opens in a new tab); Cowling 2009 (opens in a new tab); Larson 2010 (opens in a new tab); Simmerman 2011 (opens in a new tab); Suess 2012 (opens in a new tab)) were able to be pooled to compare the use of the combination of hand hygiene and medical/surgical masks with control. Four of these trials were in households, two in university student residences, and one at the annual Hajj pilgrimage. For the outcomes ILI and laboratory‐confirmed influenza, pooling demonstrated an estimate of effect suggesting little or no difference between the hand hygiene and medical/surgical mask combination and control. The number of trials and events was lower than for comparisons of hand hygiene alone, or medical/surgical masks alone, and the confidence interval was wide. For ILI, the RR for intervention compared to control was 1.03 (95% CI 0.77 to 1.37; 4504 participants; Analysis 4.1.1), and for influenza it was 0.97 (95% CI 0.69 to 1.36; 3121 participants; Analysis 4.1 (opens in a new tab).2). Full results of these trials are shown in Table 3 (opens in a new tab)
Open in table viewer (opens in a new tab)
Table 3. Results from trials of hand hygiene + medical/surgical masks compared to control
CI: confidence interval
cluster‐RCT: cluster‐randomised controlled trial
FM: face mask
HH: hand hygiene
HS: hand sanitiser
HW: hand‐washing
ILI: influenza‐like illness
OR: odds ratio
RCT: randomised controlled trial
URI: upper respiratory infection
vs: versus
- Adverse events related to the intervention
Adverse events related to mask wearing in the study by Suess 2012 (opens in a new tab) are reported under Comparison 1 (medical/surgical masks). There was no mention of adverse events related to hand hygiene.
Secondary outcomes
- Deaths
Not reported.
- Severity of viral respiratory illness as reported in the studies
Not reported.
- Absenteeism
Not reported.
- Hospital admissions
Not reported.
- Complications related to the illness, e.g. pneumonia
Not reported.
Comparison 5: Hand hygiene + medical/surgical masks compared to hand hygiene
Primary outcomes
- Numbers of cases of viral respiratory illness (including ARIs, ILI and laboratory‐confirmed influenza)
Three trials studied the addition of medical/surgical masks to hand hygiene (Cowling 2009 (opens in a new tab); Larson 2010 (opens in a new tab); Simmerman 2011 (opens in a new tab)). All three trials had three arms, and are also included in the comparison of hand hygiene plus medical/surgical mask versus control (Comparison 4). All three studies showed no difference between hand hygiene plus medical/surgical mask groups and hand hygiene alone, for all outcomes. The estimates of effect suggested little or no difference when adding masks to hand hygiene compared to hand hygiene alone: for the outcome ILI (RR 1.03, 95% CI 0.69 to 1.53; 3 trials) and the outcome laboratory‐confirmed influenza (RR 0.99, 95% CI 0.69 to 1.44), the estimates of effect were not different and the CIs were relatively wide, suggesting little or no difference (Analysis 5.1 (opens in a new tab)). However, the CIs around the estimates were wide and do not rule out an important benefit.
- Adverse events related to the intervention
Not reported.
Secondary outcomes
- Deaths
Not reported.
- Severity of viral respiratory illness as reported in the studies
Not reported.
- Absenteeism
Not reported.
- Hospital admissions
Not reported.
- Complications related to the illness (e.g. pneumonia)
Not reported.
Comparison 6: Medical/surgical masks compared to other (non‐N95) masks
One trial compared medical/surgical masks with cloth masks in hospital healthcare workers (MacIntyre 2015 (opens in a new tab)), and another trial compared catechin‐treated masks versus control masks in healthcare workers and staff of hospitals, rehabilitation centres, and nursing homes in Japan (Ide 2016 (opens in a new tab)).
Primary outcomes
- Numbers of cases of viral respiratory illness (including ARIs, ILI, and laboratory‐confirmed influenza)
MacIntyre 2015 (opens in a new tab) found that the rate of ILI was higher in the cloth mask arm compared to the medical/surgical masks arm (RR 13.25, 95% CI 1.74 to 100.97).
Ide 2016 (opens in a new tab) did not find a benefit from the catechin‐treated masks over untreated masks on influenza infection rates (adjusted odds ratio (OR) 2.35, 95% CI 0.40 to 13.72; P = 0.34).
- Adverse events related to the intervention
In MacIntyre 2015 (opens in a new tab) adverse events associated with face mask use were reported in 40.4% (227/562) of HCWs in the medical/surgical mask arm and 42.6% (242/568) in the cloth mask arm (P = 0.45). The most frequently reported adverse events were general discomfort (35.1%; 397/1130) and breathing problems (18.3%; 207/1130). Laboratory tests showed the penetration of particles through the cloth masks to be very high (97%) compared with medical/surgical masks (44%). Ide 2016 (opens in a new tab) reported that there were no serious adverse events associated with the intervention.
Secondary outcomes
- Deaths
Not reported.
- Severity of viral respiratory illness as reported in the studies
Not reported.
- Absenteeism
Not reported.
- Hospital admissions
Not reported.
- Complications related to the illness (e.g. pneumonia)
Not reported.
Comparison 7: Soap + water compared to sanitiser, and comparisons of different types of sanitiser
Two trials compared soap and water with sanitiser (Azor‐Martinez 2018 (opens in a new tab); Savolainen‐Kopra 2012 (opens in a new tab)). Another trial compared different types of hand sanitiser in a virus challenge study (Turner 2004a (opens in a new tab); Turner 2004b (opens in a new tab)), and one trial studied the frequency of use of hand sanitiser (Pandejpong 2012 (opens in a new tab)). The full results of these four trials are shown in Table 4 (opens in a new tab).
Open in table viewer (opens in a new tab)
Table 4. Results from trials of soap + water compared to hand sanitisers
CI: confidence interval
cluster‐RCT: cluster‐randomised controlled trial
HH: hand hygiene
ILI: influenza‐like illness
NS: non‐significant
RCT: randomised controlled trial
URI: upper respiratory infection
vs: versus
Primary outcomes
- Numbers of cases of viral respiratory illness (including ARIs, ILI, and laboratory‐confirmed influenza)
In the trial by Azor‐Martinez 2018 (opens in a new tab), ARI incidence was significantly higher in the soap‐and‐water group compared with the hand sanitiser group (rate ratio 1.21, 95% CI 1.06 to 1.39). In contrast, there was no significant difference between interventions in Savolainen‐Kopra 2012 (opens in a new tab). In the rhinovirus challenge study (Turner 2004a (opens in a new tab); Turner 2004b (opens in a new tab)), all hand sanitisers tested led to a significant lowering of infection rates, but no differences between sanitisers were observed. The study sample size was small.
- Adverse events related to the intervention
Two trials stated that no adverse events were observed (Pandejpong 2012 (opens in a new tab); Savolainen‐Kopra 2012 (opens in a new tab)).
Secondary outcomes
- Deaths
Not reported.
- Severity of viral respiratory illness as reported in the studies
Not reported.
- Absenteeism
The authors of Azor‐Martinez 2018 (opens in a new tab) also observed a significant benefit for hand sanitiser in reduction in days absent, whereas there was no difference between intervention groups in the Savolainen‐Kopra 2012 (opens in a new tab) trial. The study on frequency of use of sanitiser found that use of sanitiser every hour significantly reduced days absent compared with use every two hours or with use only before the lunch break (Pandejpong 2012 (opens in a new tab)).
- Hospital admissions
Not reported.
- Complications related to the illness (e.g. pneumonia)
Not reported.
Comparison 8: Surface/object disinfection (with or without hand hygiene) compared to control
Primary outcomes
- Numbers of cases of viral respiratory illness (including ARIs, ILI, and laboratory‐confirmed influenza)
Six trials contributed data to this comparison (Ban 2015 (opens in a new tab); Carabin 1999 (opens in a new tab); Ibfelt 2015 (opens in a new tab); Kotch 1994 (opens in a new tab); McConeghy 2017 (opens in a new tab); Sandora 2008 (opens in a new tab)). Full results of these trials are shown in Table 5 (opens in a new tab). Five of the six trials combined disinfection with other interventions such as hand hygiene education, provision of hand hygiene products, and audits. Ban 2015 (opens in a new tab) utilised a combination of provision of hand hygiene products, and cleaning and disinfection of surfaces, and demonstrated a significant reduction in ARI in the intervention group (OR 0.47, 95% CI 0.48 to 0.65). A similar result was seen in Carabin 1999 (opens in a new tab), with a significant reduction in episodes of ARI. Two studies tested multi component interventions and observed no significant difference in ARI outcomes (Kotch 1994 (opens in a new tab); McConeghy 2017 (opens in a new tab)).
Open in table viewer (opens in a new tab)
Table 5. Results from trials of surface/object disinfection (with or without hand hygiene) compared to control
CI: confidence interval
cluster‐RCT: cluster‐randomised controlled trial
IRR: incident rate ratio
OR: odds ratio
RCT: randomised controlled trial
RSV: respiratory syncytial virus
URTI: upper respiratory tract infection
vs: versus
One trial compared disinfection alone to usual care (Ibfelt 2015 (opens in a new tab)). This study demonstrated a significant reduction in some viruses detected on surfaces in the childcare centres (adenovirus, rhinovirus, respiratory syncytial virus (RSV), and metapneumovirus), but not in other viruses, including coronavirus.
- Adverse events related to the intervention
Not reported.
Secondary outcomes
- Deaths
Not reported.
- Severity of viral respiratory illness as reported in the studies
Not reported.
- Absenteeism
Only one study measured this outcome (Sandora 2008 (opens in a new tab)), observing no significant difference between groups for the outcome of absence due to respiratory illness (rate ratio for intervention to control 1.10, 95% CI 0.97 to 1.24).
- Hospital admissions
Not reported.
- Complications related to the illness (e.g. pneumonia)
Not reported.
Comparison 9: Complex interventions compared to control
Complex interventions are either multifaceted environmental programmes (such as those in low‐income countries) or combined interventions including hygiene measures and gloves, gowns, and masks.
Four trials studied complex hygiene and sanitation interventions in low‐income country settings (Chard 2019 (opens in a new tab); Hartinger 2016 (opens in a new tab); Huda 2012 (opens in a new tab); Najnin 2019 (opens in a new tab)). Full results from these studies are given in Table 6 (opens in a new tab).
Open in table viewer (opens in a new tab)
Table 6. Results from trials of complex interventions compared to control
ARI: acute respiratory infection
CI: confidence interval
cluster‐RCT: cluster‐randomised controlled trial
NS: non‐significant
RCT: randomised controlled trial
vs: versus
Primary outcomes
- Numbers of cases of viral respiratory illness (including ARIs, ILI, and laboratory‐confirmed influenza)
All four trials of complex interventions observed no significant differences between groups in rates of viral respiratory illness.
- Adverse events related to the intervention
Not reported.
Secondary outcomes
- Deaths
Not reported.
- Severity of viral respiratory illness as reported in the studies
Not reported.
- Absenteeism
Not reported.
- Hospital admissions
Not reported.
- Complications related to the illness (e.g. pneumonia)
Not reported.
Comparison 10: Physical distancing/quarantine
We found three RCTs that assessed physical distancing/quarantine interventions. A quasi‐cluster‐RCT assessed the effectiveness of quarantining workers of one of two sibling companies in Japan whose family members developed an ILI during the 2009 to 2010 H1N1 influenza pandemic (Miyaki 2011 (opens in a new tab)). Workers in the intervention group were asked to stay home on full pay until five days after the household member(s) showed resolution of symptoms or two days after alleviation of fever. A second RCT conducted during the SARS‐CoV‐2 pandemic investigated whether attending fitness centres with physical distancing was non‐inferior compared to no access in terms of COVID‐19 transmission (Helsingen 2021 (opens in a new tab)). The third study was a cluster‐RCT conducted during the SARS‐CoV‐2 pandemic that compared voluntary daily lateral flow device testing for seven days with negative contacts remaining at school to self‐isolation of school‐based COVID‐19 contacts for 10 days in a non‐inferiority design (Young 2021 (opens in a new tab)).
Primary outcomes
- Numbers of cases of viral respiratory illness (including laboratory‐confirmed influenza and SARS‐CoV‐2)
Miyaki 2011 (opens in a new tab) reported adherence with the intervention was 100%. In the intervention group 2.75% of workers contracted influenza, compared with 3.18% in the control group (Cox hazard ratio 0.799, 95% CI 0.66 to 0.97; P = 0.02), indicating that the rate of infection was reduced by 20% in the intervention group. However, the risk of a worker being infected was 2.17‐fold higher in the intervention group where workers stayed at home with their infected family members. The authors concluded that quarantining workers who have infected household members could be a useful additional measure to control the spread of respiratory viruses in an epidemic setting.
Helsingen 2021 (opens in a new tab) reported 3016 participants were tested for SARS‐CoV‐2 resulting in one positive case in the fitness centre access arm versus zero in the no access arm at 14 days (risk difference (RD) 0.053%, 95% CI − 0.050 to 0.156%; P = 0.32). In addition, 11 in the fitness centre access arm versus 27 in the no access arm tested positive for SARS‐CoV‐2 antibodies at one month (RD − 0.87%, 95% CI − 1.52% to − 0.23%; P = 0.001). The authors concluded that access to fitness centres with physical distancing and low population prevalence of SARS‐CoV‐2 infection did not increase risk of SARS‐CoV‐2 infection.
Results from Young 2021 (opens in a new tab) suggested no difference between the two treatment arms for SARS‐CoV‐2 infection (RR 0.96, 95% CI 0.75 to 1.22) leading the study authors to conclude non‐inferiority of daily contact testing of school‐based contacts (intervention) compared to self‐isolation (control).
- Adverse events related to the intervention
Not reported.
Secondary outcomes
- Deaths
Not reported.
- Severity of viral respiratory illness as reported in the studies
Not reported.
- Absenteeism
Young 2021 (opens in a new tab) reported COVID‐19 related absences from school were similar in the two treatment groups (RR 0.80, 95% CI 0.54 to 1.19).
- Hospital admissions
Helsingen 2021 (opens in a new tab) reported no hospital admissions in either treatment arm.
- Complications related to the illness (e.g. pneumonia)
Not reported.
Comparison 11: Eye protection compared to control
Primary outcomes
- Numbers of cases of viral respiratory illness (including laboratory‐confirmed influenza and SARS‐CoV‐2)
We only identified one trial of eye protection which was a preprint only (Fretheim 2022a (opens in a new tab)). This was a pragmatic RCT conducted in Norway from 2 February to 24 April 2022, where 3717 participants were randomised to an intervention group asked to wear glasses (e.g. sunglasses) for two weeks when close to others in public spaces. COVID‐19 cases in the national registry were 3.7% in the intervention group (68/1852) and 3.5% (65/1865) in the control group (RR 1.10, 95% CI 0.75 to 1.50). Positive COVID‐19 tests based on self‐reporting were 9.6% and 11.5% (RR 0.83, 95% CI 0.69 to 1.00). Given the high risk of bias and wide CIs, no policy conclusions can be drawn, but replication studies are clearly warranted. Almost a third of the participants reported respiratory infections. However, a lower proportion of those (215 participants) were in the intervention group compared to the control group (RR 0.90; 95% CI 0.82 to 0.99).
- Adverse events related to the intervention
A total of 76 participants reported a negative experience from participating in the trial (53 in the intervention group and 23 in the control group). The most common complaint related to the combination of wearing glasses and face masks, and 21 participants in the intervention group cited fogging as an issue. Some participants reported feeling tired or uncomfortable wearing glasses, and a few participants complained of reduced vision when wearing sunglasses or reading glasses. In the control group some participants reported headaches from not being able to wear glasses, and one participant in the intervention group reported a fall due to reduced vision.
Secondary outcomes
- Deaths
Not reported.
- Severity of viral respiratory illness as reported in the studies
Not reported.
- Absenteeism
Not reported.
- Hospital admissions
Not reported.
- Complications related to the illness, e.g. pneumonia
Not reported.
Comparison 12: Gargling/nose rinsing compared to control
Five trials investigated the effect of gargling/nose rinsing. Satomura 2005 (opens in a new tab) compared throat gargling with povidone‐iodine versus tap water in healthy adults. Ide 2014 (opens in a new tab) compared gargling with green tea versus tap water in high school students, and Goodall 2014 (opens in a new tab) compared gargling with tap water with no gargling in university students. Two additional trials were conducted during the SARS‐CoV‐2 pandemic: Almanza‐Reyes 2021 (opens in a new tab) compared silver mouth wash/nose rinse versus conventional mouthwashes and nose rinse in health workers; and Gutiérrez‐García 2022 (opens in a new tab) compared neutral electrolysed water mouth and nose rinses versus no rinses in health workers.
Primary outcomes
- Numbers of cases of viral respiratory illness (including ARIs, ILI, and laboratory‐confirmed influenza and SARS‐CoV‐2)
Satomura 2005 (opens in a new tab) reported that gargling with tap water reduced the incidence of URTIs compared to the control group (usual care) (hazard ratio (HR) 0.60, 95% CI 0.39 to 0.95). Gargling with povidone‐iodine did not reduce the incidence of URTIs compared to the control group (HR 0.88, 95% CI 0.58 to 1.34).
Goodall 2014 (opens in a new tab) found no difference in laboratory‐confirmed URTIs between the gargling (tap water) and no‐gargling groups (RR for gargling versus no gargling 0.82, 95% CI 0.53 to 1.26; P = 0.36).
In a meta‐analysis of gargling versus control based on two trials the pooled estimate of effect suggested little or no difference for the outcome of clinical URTI due to gargling (RR 0.91, 95% CI 0.63 to 1.31; 830 participants; Analysis 6.1 (opens in a new tab)) (Goodall 2014 (opens in a new tab); Satomura 2005 (opens in a new tab)).
There was no difference in the incidence of laboratory‐confirmed influenza between high school students gargling with green tea compared with those using tap water (adjusted OR 0.69, 95% CI 0.37 to 1.28; P = 0.24) (Ide 2014 (opens in a new tab)). There was also no difference in the incidence of clinically defined influenza (adjusted OR 0.75, 95% CI 0.50 to 1.13; P = 0.17). However, the authors reported that adherence to the interventions amongst students was low.
Almanza‐Reyes 2021 (opens in a new tab) reported the incidence of SARS‐CoV‐2 infection was statistically significantly lower in the silver mouth wash/nose rinse group (two out of 114, 1.8%) compared to the conventional mouthwash group (33 out of 117, 28.2%), and Gutiérrez‐García 2022 (opens in a new tab) reported the incidence of COVID‐19‐positive cases in the nasal and oral rinses group was 1% compared to 13% in the control group (RR 0.09, 95% CI of 0.01 to 0.72). A meta‐analysis of these two studies showed a 93% reduction in risk of SARS‐CoV‐2 (RR 0.07, 95% CI 0.02 to 0.23; 394 participants; Analysis 6.2 (opens in a new tab)).
- Adverse events related to the intervention
Satomura 2005 (opens in a new tab) reported no adverse events during the 60‐day intervention period. Ide 2014 (opens in a new tab) also did not observe any adverse events during the study. Goodall 2014 (opens in a new tab) did not report on adverse effects. There were no adverse reactions in the study by Almanza‐Reyes 2021 (opens in a new tab) or side effects in the study by Gutiérrez‐García 2022 (opens in a new tab).
Secondary outcomes
- Deaths
Not reported.
- Severity of viral respiratory illness as reported in the studies
Satomura 2005 (opens in a new tab) reported that the mean peak score in bronchial symptoms was lower in the water gargling group (0.97) than in the povidone‐iodine gargling group (1.41) and the control group (1.40), P = 0.055. Other symptoms were not significantly different between groups. Goodall 2014 (opens in a new tab) reported that symptom severity was greater in the gargling group for clinical and laboratory‐confirmed URTI, but this was not statistically significant (225.3 versus 191.8, and 210.5 versus 191.8, respectively). Ide 2014 (opens in a new tab) did not report symptom or illness severity.
- Absenteeism
Not reported.
- Hospital admissions
Not reported.
- Complications related to the illness (e.g. pneumonia)
Not reported.
Comparison 13: Virucidal tissues compared to control
Two reports (three trials) conducted in the USA studied the effect of virucidal tissues (Farr 1988a (opens in a new tab); Farr 1988b (opens in a new tab); Longini 1988 (opens in a new tab)). Full results from these studies are given in Table 7 (opens in a new tab).
Open in table viewer (opens in a new tab)
Table 7. Results from trials of virucidal tissues compared to control
cluster‐RCT: cluster‐randomised controlled trial
DB‐PC: double‐blind, placebo‐controlled
NS: non‐significant
RCT: randomised controlled trial
vs: versus
Primary outcomes
- Numbers of cases of viral respiratory illness (including ARIs, ILI, and laboratory‐confirmed influenza)
The three trials of virucidal tissues reported no differences in infection rates between tissues and placebo, and between tissues and no tissues (Farr 1988a (opens in a new tab); Farr 1988b (opens in a new tab); Longini 1988 (opens in a new tab)).
- Adverse events related to the intervention
Farr 1988b (opens in a new tab) reported cough in 4% of participants using virucidal tissues versus 57% in the placebo group, but 24% reported nasal burning in the virucidal tissue group versus 8% in the placebo group. Longini 1988 (opens in a new tab) did not report on adverse effects.
Secondary outcomes
- Deaths
Not reported.
- Severity of viral respiratory illness as reported in the studies
Not reported.
- Absenteeism
Not reported.
- Hospital admissions
Not reported.
- Complications related to the illness (e.g. pneumonia)
Not reported.
Discussion
Summary of main results
See Table 8 (opens in a new tab).
Open in table viewer (opens in a new tab)
Table 8. Summary of main results of the review for the primary outcomes
ARI: acute respiratory infection
CI: confidence interval
HCW: healthcare worker
ILI: influenza‐like illness
OR: odds ratio
RCT: randomised controlled trial
RR: risk ratio
1. Medical/surgical masks compared to no masks
The pooled estimates of effect from randomised controlled trials (RCTs) and cluster‐RCTs for wearing medical/surgical masks compared to no masks in the community suggests probably little or no difference in interrupting the spread of influenza‐like illness (ILI)/COVID‐19 like illness (risk ratio (RR) 0.95, 95% confidence interval (CI) 0.84 to 1.09; moderate‐certainty evidence), or laboratory‐confirmed influenza/SARS‐CoV‐2 (RR 1.01, 95% CI 0.72 to 1.42; moderate‐certainty evidence). Six trials were cluster‐RCTs, with all participants in the intervention clusters required to wear masks, thus assessing both source control and personal protection. In two trials the clusters were households with a member with new influenza; neither trial found any protective effect (RR 1.03 in 105 households (Canini 2010 (opens in a new tab)); RR 1.21 in 145 households (MacIntyre 2009 (opens in a new tab)). In two trials the clusters were college dormitories during the influenza season; neither trial found any reduction (RR 1.10 in 37 dormitories (Aiello 2012 (opens in a new tab)); RR 0.90 in three dormitories (Aiello 2010 (opens in a new tab))). Two studies were conducted during the COVID‐19 pandemic and their addition had minimal impact on the pooled estimate of effect previously reported from the earlier studies focused on influenza (Abaluck 2022 (opens in a new tab); Bundgaard 2021 (opens in a new tab)). We excluded Aiello 2010 (opens in a new tab) from meta‐analysis since we did not consider 'randomisation' of three clusters to three arms was a proper randomised trial.
Less than half of the trials comparing masks with no masks addressed harms of mask wearing (Canini 2010 (opens in a new tab); Cowling 2008 (opens in a new tab); MacIntyre 2015 (opens in a new tab); Suess 2012 (opens in a new tab)). Warmth, respiratory difficulties, humidity, and general discomfort were the most frequently reported adverse events. Neither of the RCTs conducted during the COVID‐19 pandemic directly assessed harms of mask wearing. More adults reported no harms compared to children.
In one trial cloth masks were associated with a significantly higher risk of both ILI and laboratory‐confirmed respiratory virus infection in healthcare workers (HCWs) (MacIntyre 2015 (opens in a new tab)). In addition, filtration capacity of the two‐ply cotton cloth masks was found to be only 3% and markedly less than with medical/surgical masks based on standardised particle testing. The authors suggested moisture retention, poor filtration, and penetration of the virus through the mask as plausible explanations for the increased risk of infection.
We did not find any randomised trials assessing the effectiveness of barrier interventions using a combination of masks, gloves, and gowns.
2. N95 respirators compared to medical/surgical masks
Comparisons between N95 respirators and medical/surgical masks, used as needed for exposure to at‐risk patients, for the outcomes of clinical respiratory illness and the outcome of laboratory‐confirmed influenza showed estimates of effect suggesting considerable uncertainty for any benefit of N95 respirators for the former outcome and probably little or no difference for the latter outcome. Five trials (four in healthcare settings and one in a household setting) compared N95/P2 respirators with medical/surgical masks. Pooling of three of these trials showed an estimate of effect suggesting considerable uncertainty as to whether there was any benefit comparing N95 respirators and medical/surgical face masks for the outcome of clinical respiratory illness (RR 0.70, 95% CI 0.45 to 1.10; very low‐certainty evidence), and that N95 respirators may make little or no difference for the outcome of ILI (RR 0.82, 95% CI 0.66 to 1.03; low‐certainty evidence), and probably little or no difference for the outcome of laboratory‐confirmed influenza (RR 1.10, 95% CI 0.90 to 1.34; moderate‐certainty evidence). The presence of imprecision (wide CIs) and heterogeneity, particularly for the more subjective and less precise outcomes of clinical respiratory illness and ILI compared to laboratory‐confirmed influenza infection, makes it difficult to assess whether there may be a benefit of either medical/surgical masks or N95/P2 respirators. Restricting the pooling to HCWs made no difference to the overall findings. The two trials with the largest event rates were quite consistent in their findings of no significant differences between N95 and medical/surgical masks for the outcomes of laboratory‐confirmed influenza and all laboratory‐confirmed viral infections (Loeb 2009 (opens in a new tab); Radonovich 2019 (opens in a new tab)). Three of the trials contributing to this analysis were carried out by members of the same group (MacIntyre 2009 (opens in a new tab); MacIntyre 2011 (opens in a new tab); MacIntyre 2013 (opens in a new tab)).
In general, harms were poorly reported or not reported at all in trials comparing N95 respirators with surgical masks. General discomfort resulting in reduced wear adherence was the most frequently reported harm.
3. Hand hygiene compared to control
We found that the estimate of effect may offer a benefit for hand hygiene for the composite outcome 'acute respiratory infections (ARI) or ILI or influenza' (RR 0.89, 95% CI 0.83 to 0.94; low‐certainty evidence), and probably offers a benefit for the outcomes ARI alone (RR 0.86, 95% CI 0.81 to 0.90; moderate‐certainty evidence), and absenteeism (RR 0.64, 95% CI 0.58 to 0.71). An observed estimate of effect in favour of hand hygiene for laboratory‐confirmed influenza, but with wider CIs may be a consequence of smaller sample sizes in conjunction with a more rigorous outcome measure.
4. Hand hygiene + medical/surgical masks compared to control
The estimate of effect of combined hand hygiene and medical/surgical mask interventions compared to control in six (mostly small) trials suggested that the intervention may make little or no difference for the outcomes ILI (RR 1.03, 95% CI 0.77 to 1.37), and laboratory‐confirmed influenza (four trials) (RR 0.97, 95% CI 0.69 to 1.36).
5. Hand hygiene + medical/surgical masks compared to hand hygiene
We also found an estimate of effect suggesting that adding medical/surgical masks to hand hygiene compared to hand hygiene alone may make little or no difference for the outcomes ILI (RR 1.03, 95% CI 0.69 to 1.53; 3 trials), and laboratory‐confirmed influenza (RR 0.99, 95% CI 0.69 to 1.44).
6. Medical/surgical masks compared to other (non‐N95) masks
One trial found that medical/surgical masks were more effective than cloth masks at reducing the rate of ILI (RR 13.25, 95% CI 1.74 to 100.97) (MacIntyre 2015 (opens in a new tab)), but the extremely wide CIs make this finding difficult to interpret. One trial did not find a benefit from catechin‐treated masks over untreated masks on influenza infection rates (adjusted odds ratio (OR) 2.35, 95% CI 0.40 to 13.72; P = 0.34) (Ide 2016 (opens in a new tab)).
Harms of wearing masks were reported in 40.4% of HCWs using medical/surgical masks, and in 42.6% of those wearing cloth masks (P = 0.45) (MacIntyre 2015 (opens in a new tab)). The penetration of particles was higher in cloth masks (97%) compared to medical/surgical masks (44%).
7. Soap + water compared to sanitiser, and comparisons of different types of sanitiser
There were too few trials comparing different types of hand hygiene interventions to be certain of any true differences between soap and water, alcohol‐based hand sanitisers, or other types of interventions. Also, it is uncertain whether the incremental effect of adding virucidals or antiseptics to hand‐washing actually decreased the respiratory disease burden outside the confines of the rather atypical studies. The extra benefit may have been, at least in part, accrued by confounding additional routines.
8. Surface/object disinfection (with or without hand hygiene) compared to control
We identified six trials on surface/object disinfection (with or without hand hygiene), and although they were heterogeneous (and therefore could not be pooled), three of them showed a clear benefit compared to controls (Ban 2015 (opens in a new tab); Carabin 1999 (opens in a new tab); Ibfelt 2015 (opens in a new tab)).
We found no RCTs of nose disinfection, or disinfection of living quarters, as described in observational studies reported in Jefferson 2011 (opens in a new tab).
9. Complex interventions compared to control
Four trials studied complex hygiene and sanitation interventions, all in low‐income country settings (Chard 2019 (opens in a new tab); Hartinger 2016 (opens in a new tab); Huda 2012 (opens in a new tab); Najnin 2019 (opens in a new tab)). These trials could not be pooled due to the heterogeneity of the interventions and settings. All four trials found no significant differences between groups in the rates of viral respiratory illness.
10. Physical distancing/quarantine compared to control
We identified one trial that evaluated the effect of quarantine and found a reduction in influenza transmission to co‐workers when those with infected household members stayed home from work (Miyaki 2011 (opens in a new tab)). However, staying home increased their risk of being infected two‐fold. Two studies conducted during the COVID‐19 pandemic on SARS‐cov‐2 transmission showed (1) non‐inferiority of daily contact testing of school‐based contacts (intervention) compared to self‐isolation (control) (Young 2021 (opens in a new tab)); and (2) access to fitness centres with physical distancing and low population prevalence of SARS‐CoV‐2 infection did not increase risk of SARS‐cov‐2 infection (Helsingen 2021 (opens in a new tab)).
11. Eye protection compared to control
We only identified one trial of eye protection which was a preprint only (Fretheim 2022a (opens in a new tab)).
12. Gargling compared to control
Three trials addressed the use of gargling in preventing respiratory infections (Goodall 2014 (opens in a new tab); Ide 2014 (opens in a new tab); Satomura 2005 (opens in a new tab)). Although the trials used a variety of liquids and different outcomes, pooling the results of the two trials that compared gargling with tap water versus control did not show a favourable effect in reducing URTIs (RR 0.91, 95% CI 0.63 to 1.31) (Goodall 2014 (opens in a new tab); Satomura 2005 (opens in a new tab)). Two trials of mouthwash/nose rinse were conducted during the SARS‐cov‐2 pandemic in HCWs: Almanza‐Reyes 2021 (opens in a new tab) compared silver mouth wash/nose rinse versus conventional mouthwashes and nose rinse; and Gutiérrez‐García 2022 (opens in a new tab) compared neutral electrolysed water mouth and nose rinses versus no rinses. Both studies reported large protective effects of the intervention on SARS‐CoV‐2 infection with reported outcomes of SARS‐C0V‐2 infection in 28.2% and 12.7% in the HCWs not using the interventions versus 1.8% and 1.2% in those using the intervention, despite the use of full personal protective equipment (PPE) and the high outcome rates raise questions about risk of bias, and no data were provided about baseline rates in other settings with full use of PPE.
13. Virucidal tissues compared to control
Two reports (three trials) identified in Jefferson 2011 (opens in a new tab) studied the effect of virucidal tissues compared to placebo or no tissues (Farr 1988a (opens in a new tab); Farr 1988b (opens in a new tab); Longini 1988 (opens in a new tab)). These trials found no differences in infection rates and could not be pooled.
Overall completeness and applicability of evidence
Several features need consideration before making generalisations based on the included studies.
The settings of the included studies, which were conducted over five decades, were heterogeneous and ranged from suburban schools, Carabin 1999 (opens in a new tab), to emergency departments, intensive care units, and paediatric wards, Loeb 2009 (opens in a new tab), in high‐income countries; slums in low‐income countries (Luby 2005 (opens in a new tab)); and an upper Manhattan immigrant Latino neighbourhood (Larson 2010 (opens in a new tab)). Few attempts were made to obtain socio‐economic diversity by (for example) involving more schools in the evaluations of the same programme. We identified only a few studies from low‐income countries, where the vast majority of the burden of ARIs lies and where inexpensive interventions are so critical. Additionally, limited availability of over‐the‐counter medications and national universal comprehensive health insurance provided with consequent physician prescription of symptomatic treatment may further limit the generalisability of findings.
The included trials generally reported few events and were conducted mostly during non‐epidemic periods with the exception of the trials carried out during the influenza H1N1 and SARS‐CoV‐2 pandemics. The large study by Radonovich 2019 (opens in a new tab) is an exception as it crossed over two of the highest reporting years for influenza in the USA between 2010 and 2017 (Elflein 2019 (opens in a new tab)). None of the trials were conducted during pandemics of SARS‐CoV‐1or in outbreaks of Middle East respiratory syndrome (MERS).
Of the trials assessing the effect of masks, six were carried out in those at greater exposure (i.e. HCWs) (Jacobs 2009 (opens in a new tab); Loeb 2009 (opens in a new tab); MacIntyre 2011 (opens in a new tab); MacIntyre 2013 (opens in a new tab); MacIntyre 2015 (opens in a new tab); Radonovich 2019 (opens in a new tab)). None of these studies included HCWs undertaking aerosol‐generating procedures, for which the World Health Organization (WHO) currently recommends the N95 or equivalent mask. Three trials on hand hygiene interventions were carried out in nursing homes, and included HCWs (McConeghy 2017 (opens in a new tab); Temime 2018 (opens in a new tab); Yeung 2011 (opens in a new tab)). The scarcity of RCTs on HCWs limits the generalisability of such results.
The variable quality of the methods of some studies is striking. Incomplete or no reporting of randomisation (Turner 2004a (opens in a new tab)), blinding (Farr 1988a (opens in a new tab); Farr 1988b (opens in a new tab)), numerators and denominators (Carabin 1999 (opens in a new tab); Kotch 1994 (opens in a new tab)), interventions, and cluster coefficients in the relevant trials (Carabin 1999 (opens in a new tab)), led to a considerable loss of information. Potential biases were often not discussed.
Inappropriate placebos caused design problems. In some studies the placebo probably carried sufficient effect to dilute the intervention effects (Longini 1988 (opens in a new tab)). Two valiant attempts with virucidal tissues probably failed because placebo handkerchiefs were impregnated with a dummy compound that stung the users' nostrils (Farr 1988a (opens in a new tab); Farr 1988b (opens in a new tab)).
Some studies used impractical interventions. Volunteers subjected to the intervention hand cleaner (organic acids) were not allowed to use their hands between cleaning and virus challenge, so the effect of normal use of the hands on the intervention remains unknown (Turner 2004a (opens in a new tab); Turner 2004b (opens in a new tab)). Two per cent aqueous iodine painted on the hands, although a successful antiviral intervention, causes unacceptable cosmetic staining, which is impractical for all but those at the highest risk of epidemic contagion (Gwaltney 1980 (opens in a new tab)).
Adherence with interventions, especially educational programmes, was a problem for many studies despite the importance of many such low‐cost interventions. Adherence with mask wearing varied; it was generally around 60% to 80%, but was reported to be as low as 40% (see Table 1 (opens in a new tab)). Overall, the logistics of carrying out trials that involve sustained behaviour change are demanding, particularly in challenging settings such as immigrant neighbourhoods or students' halls of residence.
The identified trials provided sparse and unsystematic data on adverse effects of the intervention, and few of the RCTs measured or reported adherence with the intervention, which is especially important for the use of medical/surgical masks or N95 respirators. No studies investigated how the level of adherence may have influenced the effect size.
We identified one study assessing the effects of eye protection (Fretheim 2022a (opens in a new tab)), and we identified three studies on physical distancing/quarantine (Helsingen 2021 (opens in a new tab); Miyaki 2011 (opens in a new tab); Young 2021 (opens in a new tab)). The dearth of evidence and predominant setting of seasonal viral circulation limits generalisability of our findings to other contexts and any future epidemics due to other respiratory viruses such as the COVID‐19 pandemic although there have been increasing numbers of RCTs and cluster‐RCTs in the latter setting which are adding to the evidence base.
The two recent small trials from Mexico assessing local mouth/nose rinses airways prophylactic as interventions treatments report large but uncertain reductions in transmission to healthcare workers which warrant further study and replication by other investigator (Almanza‐Reyes 2021 (opens in a new tab); Gutiérrez‐García 2022 (opens in a new tab)).
Certainty of the evidence
We found the available evidence base identified through our search processes to be of variable quality. Reporting of sequence generation and allocation concealment were poor in 30% to 50% of studies across the categories of intervention comparisons. Given the nature of the intervention comparison, blinding of treatment allocation after randomisation was rarely achieved. Although blinding of outcome assessment is highly feasible and desirable, most outcomes were assessed by self‐reports. Outcomes in some studies were poorly defined, with a lack of clarity as to the possible aetiological agents (bacterial versus viral). Some studies used laboratory‐confirmed outcomes, both adding precision and avoiding indirectness by having an accurate outcome measure and lowering the risk of bias (see Table 9 (opens in a new tab) for heterogeneity of trial outcome definitions). We found no evidence of selective reporting of outcomes within the included studies. We believe publication bias is unlikely, as the included studies demonstrated a range of effects, both positive and negative, over all study sizes. The variable quality of the studies hampers drawing any firm conclusions.
Open in table viewer (opens in a new tab)
Table 9. Trial authors’ outcome definitions
ALRI: acute lower respiratory infection
ARIs: acute respiratory infections
CDC: Centers for Disease Control and Prevention
CI: confidence interval
cluster‐RCT: cluster‐randomised controlled trial
CRI: clinical respiratory illness
DB‐PC: double‐blind, placebo‐controlled
DB‐RCT: double‐blind randomised controlled trial
DNA: deoxyribonucleic acid
ELISA: enzyme‐linked immunosorbent assay
GI: gastrointestinal
h: hours
HCW: healthcare workers
HI: haemagglutinin
hMPV: human metapneumo virus
ICD‐9: International Classification of Disease, 9th Revision, Clinical Modification
ICD‐10: International Classification of Disease, 10th Revision, Clinical Modification
IgG: immunoglobulin G
IgM: immunoglobulin M
ILI: influenza‐like illness
min: minutes
MRSA: methicillin‐resistant Staphylococcus aureus
NAT: nucleic acid testing
NOS: not otherwise specified
NTS: nasal and throat swab
PCR: polymerase chain reaction
PIV: parainfluenza virus
POCT: point‐of‐care testing
RCT: randomised controlled trial
RI: respiratory infection
RNA: ribonucleic acid
RR: risk ratio
rRT‐PCR: real‐time reverse transcriptase polymerase chain reaction
RSV: respiratory syncytial virus
RTI: respiratory tract infection
RT‐PCR: reverse transcriptase polymerase chain reaction
SAR: secondary attack ratios
SD: standard deviation
S/S: signs and symptoms
URI: upper respiratory infection
URTI: upper respiratory tract infection
UTI: urinary tract infection
WHO: World Health Organization
Potential biases in the review process
The non‐drug (and often locally manufactured) nature of most of the interventions in this review, the lack of effective regulation in some settings, and the possible endless number of manufacturers make it difficult to gauge the existence of unpublished data. Non‐drug interventions typically have no or very loose regulation.
In this 2022 update, we again focused on RCTs and cluster‐RCTs, providing a higher level of evidence compared with the previous version of the review, which also meta‐analysed observational studies when appropriate (Jefferson 2011 (opens in a new tab)). However, many of the trials were small and hence underpowered, and at high or unclear risk of bias due to poor reporting of methods and lack of blinding. The populations, outcomes, comparators, and interventions tested were heterogeneous.
Due to the urgency of this update in the context of the COVID‐19 pandemic, we did not contact trial authors to request missing data. This means that we have not considered studies that included other non‐respiratory infections, and did not provide stratified data by type of infection.
Agreements and disagreements with other studies or reviews
Several reviews of RCTs have found broadly similar results to this review for face masks. In a meta‐analysis comparing surgical masks with N95 respirators, Smith 2016 (opens in a new tab) pooled three trials and found an estimate of effect suggesting no difference for laboratory‐confirmed respiratory infections (OR 0.89, 95% CI 0.64 to 1.24) or ILI (OR 0.51, 95% CI 0.19 to 1.41) (Loeb 2009 (opens in a new tab); MacIntyre 2011 (opens in a new tab); MacIntyre 2013 (opens in a new tab)). A similar meta‐analysis, Offeddu 2017 (opens in a new tab), based on two trials concluded that masks (either N95/P2 respirators or medical/surgical masks) were effective against clinical respiratory infections (RR 0.59, 95% CI 0.46 to 0.77) and ILI (RR 0.34, 95% CI 0.14 to 0.82) (MacIntyre 2011 (opens in a new tab); MacIntyre 2015 (opens in a new tab)). Pooling of two studies (MacIntyre 2011 (opens in a new tab); MacIntyre 2013 (opens in a new tab)) also found an estimate of effect that favoured N95 respirators to medical/surgical masks for clinical respiratory infections (RR 0.47, 95% CI 0.36 to 0.62), but not for ILI, (RR 0.59, 95% CI 0.27 to 1.28) based on three studies (Loeb 2009 (opens in a new tab): MacIntyre 2011 (opens in a new tab); MacIntyre 2013 (opens in a new tab)). The outcome of clinical respiratory infection is considered to be the most subjective and least precise outcome.
A recent meta‐analysis included five trials comparing N95/P2 respirators with medical/surgical masks and found no difference between groups for either influenza (RR 1.09, 95% CI 0.92 to 1.28), or respiratory viral infections (RR 0.89, 95% CI 0.70 to 1.11) (Long 2020 (opens in a new tab)). By excluding Loeb 2009 (opens in a new tab) (an open, non‐inferiority RCT that compared medical/surgical masks with N95 respirators in protecting HCWs against influenza), the authors reported a significant protective effect against viral infections (RR 0.61, 95% CI 0.39 to 0.98). The authors do not report a rationale for the exclusion in the sensitivity analysis, and do not report on exclusion of the studies with low weighting, which arguably would be more relevant in a sensitivity analysis. The two trials that make up 96% of the weighting demonstrated no significant differences in the outcome events (Loeb 2009 (opens in a new tab); Radonovich 2019 (opens in a new tab)). A recent meta‐analysis of four RCTs adjusting for clustering, which compared N95 respirators with the use of medical/surgical masks, found pooled estimates of effect that did not demonstrate any difference in any laboratory‐confirmed viral respiratory infection (OR 1.06, 95% CI 0.90 to 1.25), laboratory‐confirmed influenza (OR 0.94, 95% CI 0.73 to 1.20), or clinical respiratory illness (OR 1.49, 95% CI 0.98 to 2.28), with the evidence profile suggesting that there was greater imprecision and inconsistency in the outcome of clinical respiratory illness (Bartoszko 2020 (opens in a new tab)). Moreover, in another recent systematic review that assessed the effectiveness of personal protective and environmental measures in non‐healthcare settings (funded by the WHO), 10 RCTs reporting estimates of the effectiveness of face masks in reducing laboratory‐confirmed influenza virus infections in the community were identified (Xiao 2020 (opens in a new tab)). The evidence from these RCTs suggested that the use of face masks either by infected persons or by uninfected persons does not have a substantial effect on influenza transmission.
The findings from several systematic reviews and meta‐analyses over the last decade have not demonstrated any difference in the clinical effectiveness of N95 respirators or equivalent compared to the use of surgical masks when used by HCWs in multiple healthcare settings for the prevention of respiratory virus infections, including influenza.
Reviews based on observational studies have usually found a stronger protective effect for face masks, but have important biases. The review by Chu 2020 (opens in a new tab) did not consider RCTs of influenza transmission, but only the observational studies examining impact on SARS, MERS, or SARS‐CoV‐2. For N95 masks versus no mask in HCWs, there was a large protective effective with an OR of 0.04 (95% CI 0.004 to 0.30); for surgical masks versus no masks, there was an OR of 0.33 (0.17 to 0.61) overall, but four of these studies were in healthcare settings. Chu 2020 (opens in a new tab) has been criticised for several reasons: use of an outdated 'Risk of bias' tool; inaccuracy of distance measures; and not adequately addressing multiple sources of bias, including recall and classification bias and in particular confounding. Confounding is very likely, as preventive behaviours such as mask use, social distancing, and hand hygiene are correlated behaviours, and hence any effect estimates are likely to be overly optimistic.
The two RCTs of medical/surgical masks during the SARS‐CoV‐2 pandemic found uncertain evidence of a small or no effect (Abaluck 2022 (opens in a new tab); Bundgaard 2021 (opens in a new tab)). The study by Abaluck 2022 (opens in a new tab) found a statistically significant benefit of masks versus no masks for COVID‐like‐illness, however, this study was rated at high risk of bias for five of the six domains due to issues including baseline imbalance, subjective outcome assessment and incomplete follow‐up across the groups. Despite this study contributing 45% of the weight towards the meta‐analysis of influenza/COVID‐like‐illness for masks versus no masks, the updated conclusions from the analysis strengthened around little or no effect of mask use.
Also based on observational studies, Jefferson 2011 (opens in a new tab) found a protective effect of wearing surgical masks with hygienic measures compared to not wearing masks in the SARS 2003 outbreak (OR 0.32, 95% CI 0.26 to 0.39). However, the evidence was based on case‐control studies carried out during the outbreak. There was some additional but very limited supportive evidence from the cohort studies in Jefferson 2011 (opens in a new tab).
Although the use of eye protection and physical distancing measures are widely believed to be effective in reducing transmission of respiratory viruses and mitigating the impact of an influenza pandemic, we found only one trial investigating the role of self‐quarantine in reducing the incidence of H1N1 influenza events in the workplace, and no trials examining the effect of eye protection. The evidence for these measures was derived largely from observational studies and simulation studies, and the overall certainty of supporting evidence is relatively low. The finding of limited evidence evaluating these interventions was also consistent with a recent review funded by the WHO for the preparation of its guidelines on the use of non‐pharmaceutical interventions for pandemic influenza in non‐medical settings (Fong 2020 (opens in a new tab)).
There are several previous systematic reviews on hand hygiene and respiratory infections. Five of them reviewed the evidence in a community setting (Moncion 2019 (opens in a new tab); Rabie 2006 (opens in a new tab); Saunders‐Hastings 2017 (opens in a new tab); Warren‐Gash 2013 (opens in a new tab): Wong 2014 (opens in a new tab)), and three focused on children (Mbakaya 2017 (opens in a new tab); Willmott 2016 (opens in a new tab); Zivich 2018 (opens in a new tab)). The earliest review in 2006 included eight studies, three of which were RCTs (Rabie 2006 (opens in a new tab)). The pooled estimate of seven studies was described as “indicative” of the effect of hand hygiene, but the studies were of poor quality. The Warren‐Gash 2013 (opens in a new tab) review included 16 studies (10 of which were RCTs) and reported mixed and inconclusive results. A 2014 review identified 10 RCTs and reported that the combination of hand hygiene with face masks in high‐income countries (five trials) significantly reduced the incidence of laboratory‐confirmed influenza and ILI, whilst hand hygiene alone did not (Wong 2014 (opens in a new tab)). This significant reduction in laboratory‐confirmed influenza and ILI for hand hygiene and face masks may have been based on the raw numbers without adjusting for any clustering effects in the included cluster trials, which produced inappropriately narrow CIs, and possibly biased treatment effect estimates. Moreover, trials from the low‐income countries were not included in the review, and this significant effect was not demonstrated when all the trials identified in the review were combined. The Saunders‐Hastings 2017 (opens in a new tab) review of studies evaluating the effectiveness of personal protective measures in interrupting pandemic influenza transmission only identified two RCTs (Azor‐Martinez 2014 (opens in a new tab); Suess 2012 (opens in a new tab)), which reported a significant effect of hand hygiene. The Moncion 2019 (opens in a new tab) review identified seven RCTs of hand hygiene compared to control, with mixed results for preventing the transmission of laboratory‐confirmed or possible influenza. Systematic reviews of RCTs of hand hygiene interventions amongst children, Mbakaya 2017 (opens in a new tab) and Willmott 2016 (opens in a new tab), or at a non‐clinical workplace, Zivich 2018 (opens in a new tab), identified heterogeneous trials with quality problems including small numbers of clusters and participants, inadequate randomisation, and self‐reported outcomes. Evidence of impact on respiratory infections was equivocal.
A rapid search for other systematic reviews of RCTs was conducted in September 2022, and none of high quality were found.